Search MAFLOnline
Subscribe to MAFL Online


Contact Me

I can be contacted via Tony.Corke@gmail.com


Latest Information


Latest Posts
Monday
Jul202009

The Decline of the Humble Behind

Last year, you might recall, a spate of deliberately rushed behinds prompted the AFL to review and ultimately change the laws relating to this form of scoring.

Has the change led to a reduction in the number of behinds recorded in each game? The evidence is fairly strong:

So far this season we've seen 22.3 behinds per game, which is 2.6 per game fewer than we saw in 2008 and puts us on track to record the lowest number of average behinds per game since 1915. Back then though goals came as much more of a surprise, so a spectator at an average game in 1915 could expect to witness only 16 goals to go along with the 22 behinds. Happy days.

This year's behind decline continues a trend during which the number of behinds per game has dropped from a high of 27.3 per game in 1991 to its current level, a full 5 behinds fewer, interrupted only by occasional upticks such as the 25.1 behinds per game recorded in 2007 and the 24.9 recorded in 2008.

While behind numbers have been falling recently, goals per game have also trended down - from 29.6 in 1991, to this season's current average of 26.8. Still, AFL followers can expect to witness more goals than behinds in most games they watch. This wasn't always the case. Not until the season of 1969 had there been a single season with more goals than behinds, and not until 1976 did such an outcome became a regular occurrence. In only one season since then, 1981, have fans endured more behinds than goals across the entire season.

On a game-by-game basis, 90 of 128 games this season, or a smidge over 70%, have produced more goals than behinds. Four more games have produced an equal number of each.

As a logical consequence of all these trends, behinds have had a significantly smaller impact on the result of games, as evidenced by the chart below which shows the percentage of scoring attributable to behinds falling from above 20% in the very early seasons to around 15% across the period 1930 to 1980, to this season's 12.2%, the second-lowest percentage of all time, surpassed only by the 11.9% of season 2000.

(There are more statistical analyses of the AFL on MAFL Online's sister site at MAFL Stats.)

Monday
Jul202009

Does The Favourite Have It Covered?

You've wagered on Geelong - a line bet in which you've given 46.5 points start - and they lead by 42 points at three-quarter time. What price should you accept from someone wanting to purchase your wager? They also led by 44 points at quarter time and 43 points at half time. What prices should you have accepted then?

In this blog I've analysed line betting results since 2006 and derived three models to answer questions similar the one above. These models take as inputs the handicap offered by the favourite and the favourite's margin relative to that handicap at a particular quarter break. The output they provide is the probability that the favourite will go on to cover the spread given the situation they find themselves in at the end of some quarter.

The chart below plots these probabilities against margins relative to the spread at quarter time for 8 different handicap levels.

Negative margins mean that the favourite has already covered the spread, positive margins that there's still some spread to be covered.

The top line tracks the probability that a 47.5 point favourite covers the spread given different margins relative to the spread at quarter time. So, for example, if the favourite has the spread covered by 5.5 points (ie leads by 53 points) at quarter time, there's a 90% chance that the favourite will go on to cover the spread at full time.

In comparison, the bottom line tracks the probability that a 6.5 point favourite covers the spread given different margins relative to the spread at quarter time. If a favourite such as this has the spread covered by 5.5 points (ie leads by 12 points) at quarter time, there's only a 60% chance that this team will go on to cover the spread at full time. The logic of this is that a 6.5 point favourite is, relatively, less strong than a 47.5 point favourite and so more liable to fail to cover the spread for any given margin relative to the spread at quarter time.

Another way to look at this same data is to create a table showing what margin relative to the spread is required for an X-point favourite to have a given probability of covering the spread.

So, for example, for the chances of covering the spread to be even, a 6.5 point favourite can afford to lead by only 4 or 5 (ie be 2 points short of covering) at quarter time and a 47.5 point favourite can afford to lead by only 8 or 9 (ie be 39 points short of covering).

The following diagrams provide the same chart and table for the favourite's position at half time.

Finally, these next diagrams provide the same chart and table for the favourite's position at three-quarter time.

I find this last table especially interesting as it shows how fine the difference is at three-quarter time between likely success and possible failure in terms of covering the spread. The difference between a 50% and a 75% probability of covering is only about 9 points and between a 75% and a 90% probability is only 9 points more.

To finish then, let's go back to the question with which I started this blog. A 46.5 point favourite leading by 42 points at three-quarter time is about a 69.4% chance to go on and cover. So, assuming you backed the favourite at $1.90 your expected payout for a 1 unit wager is 0.694 x 0.9 - 0.306 = +0.32 units. So, you'd want to be paid 1.32 units for your wager, given that you also want your original stake back too.

A 46.5 point favourite leading by 44 points at quarter time is about an 85.5% chance to go on and cover, and a similar favourite leading by 43 points at half time is about an 84.7% chance to go on to cover. The expected payouts for these are +0.62 and +0.61 units respectively, so you'd have wanted about 1.62 units to surrender these bets (a little more if you're a risk-taker and a little less if you're risk-averse, but that's a topic for another day ...)

Tuesday
Jul142009

Are Footy HAMs Normal?

Okay, this is probably going to be a long blog so you might want to make yourself comfortable.

For some time now I've been wondering about the statistical properties of the Handicap-Adjusted Margin (HAM). Does it, for example, follow a normal distribution with zero mean?

Well firstly we need to deal with the definition of the term HAM, for which there is - at least - two logical definitions.

The first definition, which is the one I usually use, is calculated from the Home Team perspective and is Home Team Score - Away Team Score + Home Team's Handicap (where the Handicap is negative if the Home Team is giving start and positive otherwise). Let's call this Home HAM.

As an example, if the Home Team wins 112 to 80 and was giving 20.5 points start, then Home HAM is 112-80-20.5 = +11.5 points, meaning that the Home Team won by 11.5 points on handicap.

The other approach defines HAM in terms of the Favourite Team and is Favourite Team Score - Underdog Team Score + Favourite Team's Handicap (where the Handicap is always negative as, by definition the Favourite Team is giving start). Let's call this Favourite HAM.

So, if the Favourite Team wins 82 to 75 and was giving 15.5 points start, then Favourite HAM is 82-75-15.5 = -7.5 points, meaning that the Favourite Team lost by 7.5 points on handicap.

Home HAM will be the same as Favourite HAM if the Home Team is Favourite. Otherwise Home HAM and Favourite HAM will have opposite signs.

There is one other definitional detail we need to deal with and that is which handicap to use. Each week a number of betting shops publish line markets and they often differ in the starts and the prices offered for each team. For this blog I'm going to use TAB Sportsbet's handicap markets.

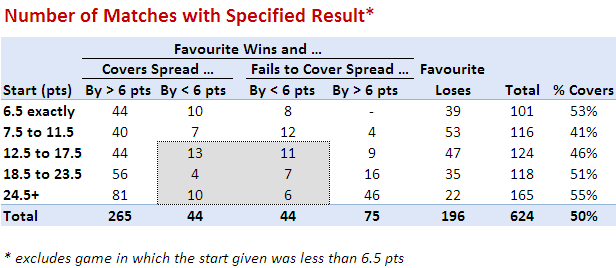
TAB Sportsbet Handicap markets work by offering even money odds (less the vigorish) on both teams, with one team receiving start and the other offering that same start. The only exception to this is when the teams are fairly evenly matched in which case the start is fixed at 6.5 points and the prices varied away from even money as required. So, for example, we might see Essendon +6.5 points against Carlton but priced at $1.70 reflecting the fact that 6.5 points makes Essendon in the bookie's opinion more likely to win on handicap than to lose. Games such as this are problematic for the current analysis because the 'true' handicap is not 6.5 points but is instead something less than 6.5 points. Including these games would bias the analysis - and adjusting the start is too complex - so we'll exclude them.

So, the question now becomes is HAM Home, defined as above and using the TAB Sportsbet handicap and excluding games with 6.5 points start or fewer, normally distributed with zero mean? Similarly, is HAM Favourite so distributed?

We should expect HAM Home and HAM Favourite to have zero means because, if they don't it suggests that the Sportsbet bookie has a bias towards or against Home teams of Favourites. And, as we know, in gambling, bias is often financially exploitable.

There's no particular reason to believe that HAM Home and HAM Favourite should follow a normal distribution, however, apart from the startling ubiquity of that distribution across a range of phenomena.

Consider first the issue of zero means.

The following table provides information about Home HAMs for seasons 2006 to 2008 combined, for season 2009, and for seasons 2006 to 2009. I've isolated this season because, as we'll see, it's been a slightly unusual season for handicap betting.

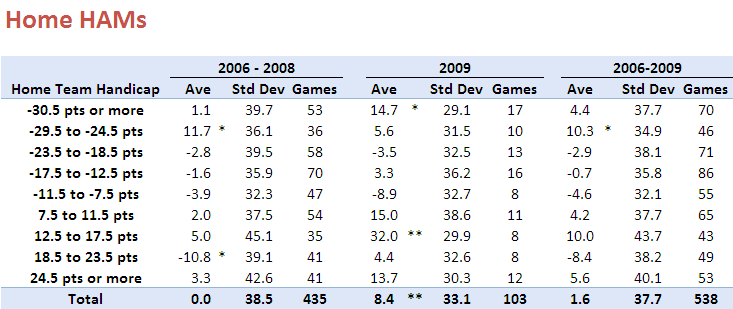
Each row of this table aggregates the results for different ranges of Home Team handicaps. The first row looks at those games where the Home Team was offering start of 30.5 points or more. In these games, of which there were 53 across seasons 2006 to 2008, the average Home HAM was 1.1 and the standard deviation of the Home HAMs was 39.7. In season 2009 there have been 17 such games for which the average Home HAM has been 14.7 and the standard deviation of the Home HAMs has been 29.1.

The asterisk next to the 14.7 average denotes that this average is statistically significantly different from zero at the 10% level (using a two-tailed test). Looking at other rows you'll see there are a handful more asterisks, most notably two against the 12.5 to 17.5 points row for season 2009 denoting that the average Home HAM of 32.0 is significant at the 5% level (though it is based on only 8 games).

At the foot of the table you can see that the overall average Home HAM across seasons 2006 to 2008 was, as we expected approximately zero. Casting an eye down the column of standard deviations for these same seasons suggests that these are broadly independent of the Home Team handicap, though there is some weak evidence that larger absolute starts are associated with slightly larger standard deviations.

For season 2009, the story's a little different. The overall average is +8.4 points which, the asterisks tell us, is statistically significantly different from zero at the 5% level. The standard deviations are much smaller and, if anything, larger absolute margins seem to be associated with smaller standard deviations.

Combining all the seasons, the aberrations of 2009 are mostly washed out and we find an average Home HAM of just +1.6 points.

Next, consider Favourite HAMs, the data for which appears below:

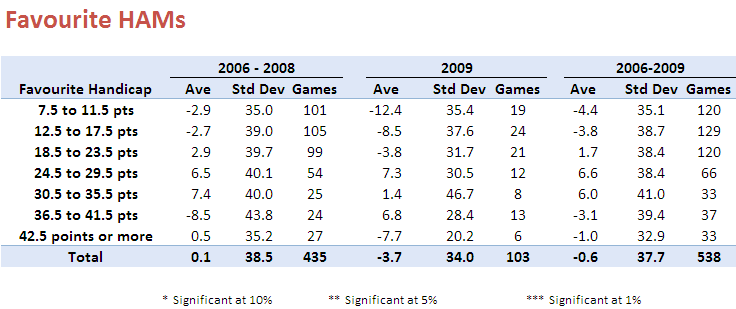
The first thing to note about this table is the fact that none of the Favourite HAMs are significantly different from zero.

Overall, across seasons 2006 to 2008 the average Favourite HAM is just 0.1 point; in 2009 it's just -3.7 points.

In general there appears to be no systematic relationship between the start given by favourites and the standard deviation of the resulting Favourite HAMs.

Summarising:

  • Across seasons 2006 to 2009, Home HAMs and Favourite HAMs average around zero, as we hoped
  • With a few notable exceptions, mainly for Home HAMs in 2009, the average is also around zero if we condition on either the handicap given by the Home Team (looking at Home HAMs) or that given by the Favourite Team (looking at Favourite HAMs).

Okay then, are Home HAMs and Favourite HAMs normally distributed?

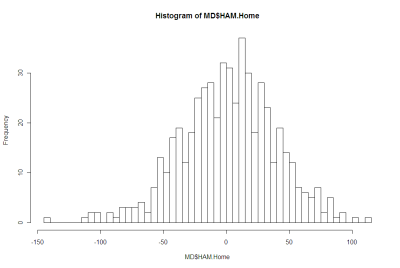
Here's a histogram of Home HAMs:

And here's a histogram of Favourite HAMs:

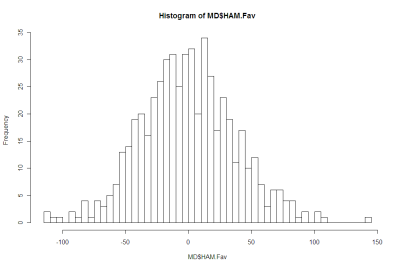
There's nothing in either of those that argues strongly for the negative.

More formally, Shapiro-Wilks tests fail to reject the null hypothesis that both distributions are Normal.

Using this fact, I've drawn up a couple of tables that compare the observed frequency of various results with what we'd expect if the generating distributions were Normal.

Here's the one for Home HAMs:

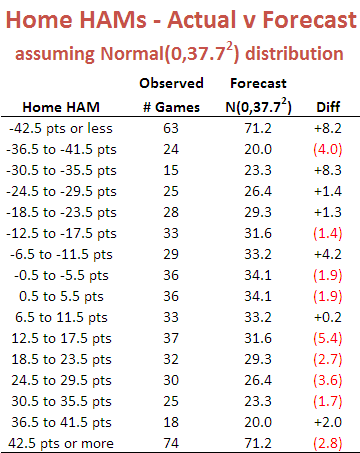
There is a slight over-prediction of negative Home HAMs and a corresponding under-prediction of positive Home HAMs but, overall, the fit is good and the appropriate Chi-Squared test of Goodness of Fit is passed.

And, lastly, here's the one for Home Favourites:

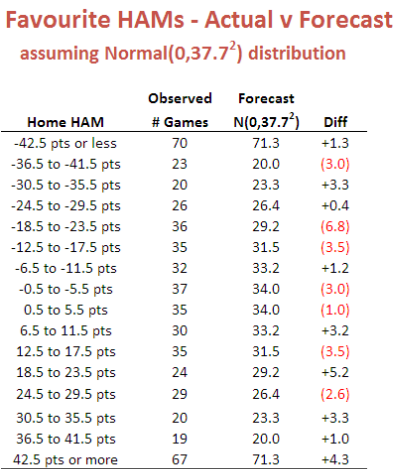
In this case the fit is even better.

We conclude then that it seems reasonable to treat Home HAMs as being normally distributed with zero mean and a standard deviation of 37.7 points and to treat Favourite HAMs as being normally distributed with zero mean and, curiously, the same standard deviation. I should point out for any lurking pedant that I realise neither Home HAMs nor Favourite HAMs can strictly follow a normal distribution since Home HAMs and Favourite HAMs take on only discrete values. The issue really is: practically, how good is the approximation?

This conclusion of normality has important implications for detecting possible imbalances between the line and head-to-head markets for the same game. But, for now, enough.

Monday
Jul062009

Another Look At Quarter-by-Quarter Performance

It's been a while since we looked at teams' quarter-by-quarter performances. This blog looks to redress this deficiency.

(By the way, the Alternative Premierships data is available as a PDF download on the MAFL Stats website .)

The table below includes each teams' percentage by quarter and its win-draw-lose record by quarter as at the end of the 14th round:

(The comments in the right-hand column in some cases make comparisons to a team's performance after Round 7. This was the subject of an earlier blog.)

Geelong, St Kilda and, to a lesser extent, Adelaide, are the kings/queens of the 1st quarter. The Cats and the Saints have both won 11 of 14 first terms, whereas the Crows, despite recording an impressive 133 percentage, have won just 8 of 14, a record that surprisingly has been matched by the 11th-placed Hawks. The Hawks however, when bad have been very, very bad, and so have a 1st quarter percentage of just 89.

Second quarters have been the province of the ladder's top 3 teams. The Saints have the best percentage (176) but the Cats have the best win-draw-lose record (10-1-3). Carlton, though 7th on the ladder, have the 5th best percentage in 2nd quarters and the equal-2nd best win-draw-lose record.

St Kilda have also dominated in the 3rd quarter racking up a league-best percentage of 186 and a 10-0-4 win-draw-lose record. Geelong and Collingwood have also established 10-0-4 records in this quarter. The Lions, though managing only a 9-1-4 win-draw-lose record, have racked up the second-best percentage in the league for this quarter (160).

Final terms, which have been far less important this year than in seasons past, have been most dominated by St Kilda and the Bulldogs in terms of percentage, and by the Dogs and Carlton in terms of win-draw-lose records.

As you'd expect, the poorer teams have tended to do poorly across all terms, though some better-positioned teams have also had troublesome quarters.

For example, amongst those teams in the ladder's top 8 or thereabouts, the Lions, the Dons and Port have all generally failed to start well, recording sub-90 percentages and 50% or worse win-draw-lose performances.

The Dons and Sydney have both struggled in 2nd terms, winning no more than 5 of them and, in the Dons' case, also drawing one.

Adelaide and Port have found 3rd terms most disagreeable, winning only, respectively, 6 and 5 of them and in so doing producing percentages of around 75.

No top-ranked team has truly flopped in the final term, though the Lions' performance is conspicuous because it has resulted in a sub-100 percentage and a 6-0-8 win-draw-lose record.

Finally, in terms of quarters won, Geelong leads on 39 followed by the Saints on 38. There's then a gap back to the Dogs and the Pies on 32.5, and then Carlton, somewhat surprisingly given its ladder position, on 32. Melbourne have only the 3rd worst performance in terms of total quarters won. They're on 19.5, ahead of Richmond on 19 and the Roos on just 16.5. That means, in an average game, the Roos can be expected to win just 1.2 quarters. Eleven of the 16.5 quarters won have come in the first half of games so, to date anyway, Roos supporters could comfortably leave at the main change without much risk of missing a winning Roos quarter or half.

Thursday
Jul022009

AFL Players Don't Shave

In a famous - some might say, infamous - paper by Wolfers he analysed the results of 44,120 NCAA Division I basketball games on which public betting was possible, looking for signs of "point shaving".

Point shaving occurs when a favoured team plays well enough to win, but deliberately not quite well enough to cover the spread. In his first paragraph he states: "Initial evidence suggests that point shaving may be quite widespread". Unsurprisingly, such a conclusion created considerable alarm and led, amongst a slew of furious rebuttals, to a paper by sabermetrician Phil Birnbaum refuting Wolfers' claim. This, in turn, led to a counter-rebuttal by Wolfers.

Wolfers' claim is based on a simple finding: in the games that he looked at, strong favourites - which he defines as those giving more than 12 points start - narrowly fail to cover the spread significantly more often than they narrowly cover the spread. The "significance" of the difference is in a statistical sense and relies on the assumption that the handicap-adjusted victory margin for favourites has a zero mean, normal distribution.

He excludes narrow favourites from his analysis on the basis that, since they give relatively little start, there's too great a risk that an attempt at point-shaving will cascade into a loss not just on handicap but outright. Point-shavers, he contends, are happy to facilitate a loss on handicap but not at the risk of missing out on the competition points altogether and of heightening the levels of suspicion about the outcome generally.

I have collected over three-and-a-half seasons of TAB Sporsbet handicapping data and results, so I thought I'd perform a Wolfers style analysis on it. From the outset I should note that one major drawback of performing this analysis on the AFL is that there are multiple line markets on AFL games and they regularly offer different points start. So, any conclusions we draw will be relevant only in the context of the starts offered by TAB Sportsbet. A "narrow shaving" if you will.

In adapting Wolfers' approach to AFL I have defined a "strong favourite" as a team giving more than 2 goals start though, from a point-shaving perspective, the conclusion is the same if we define it more restrictively. Also, I've defined "narrow victory" with respect to the handicap as one by less than 6 points. With these definitions, the key numbers in the table below are those in the box shaded grey.

These numbers tell us that there have been 27(13+4+10) games in which the favourite has given 12.5 points or more start and has won, by has won narrowly by enough to cover the spread. As well, there have been 24(11+7+6) games in which the favourite has given 12.5 points or more start and has won, but has narrowly not won by enough to cover the spread. In this admittedly small sample of just 51 games, there is then no statistical evidence at all of any point-shaving going on. In truth if there was any such behaviour occurring it would need to be near-endemic to show up in a sample this small lest it be washed out by the underlying variability.

So, no smoking gun there - not even a faint whiff of gunpowder ...

The table does, however, offer one intriguing insight, albeit that it only whispers it.

The final column contains the percentage of the time that favourites have managed to cover the spread for the given range of handicaps. So, for example, favourites giving 6.5 points start have covered the spread 53% of the time. Bear in mind that these percentages should be about 50%, give or take some statistically variability, lest they be financially exploitable.

It's the next percentage down that's the tantalising one. Favourites giving 7.5 to 11.5 points start have, over the period 2006 to Round 13 of 2009, covered the spread only 41% of the time. That percentage is statistically significantly different from 50% at roughly the 5% level (using a two-tailed test in case you were wondering). If this failure to cover continues at this rate into the future, that's a seriously exploitable discrepancy.

To check if what we've found is merely a single-year phenomenon, let's take a look at the year-by-year data. In 2006, 7.5-to 11.5-point favourites covered on only 12 of 35 occasions (34%). In 2007, they covered in 17 of 38 (45%), while in 2008 they covered in 12 of 28 (43%). This year, to date they've covered in 6 of 15 (40%). So there's a thread of consistency there. Worth keeping an eye on, I'd say.

Another striking feature of this final column is how the percentage of time that the favourites cover tends to increase with the size of the start offered and only crosses 50% for the uppermost category, suggesting perhaps a reticence on the part of TAB Sportsbet to offer appropriately large starts for very strong favourites. Note though that the discrepancy for the 24.5 points or more category is not statistically significant.