Search MAFLOnline
Subscribe to MAFL Online


Contact Me

I can be contacted via Tony.Corke@gmail.com


Latest Information


Latest Posts
Monday
Feb092009

How Important is Pre-Season Success?

With the pre-season now underway it's only right that I revisit the topic of the extent to which pre-season performance predicts regular season success.

Here's the table with the relevant data:

The macro view tells us that, of the 21 pre-season winners, only 14 of them have gone on to participate in the regular season finals in the same year and, of the 21 pre-season runners-up, only 12 of them have made that same category. When you consider that roughly one-half of the teams have made the regular season finals in each year - slightly less from 1988 to 1993, and slightly more in 1994 - those stats look fairly unimpressive.

But a closer, team-by-team view shows that Carlton alone can be blamed for 3 of the 7 occasions on which the pre-season winner has missed the regular season finals, and Adelaide and Richmond can be blamed for 4 of the 9 occasions on which the pre-season runner-up has missed the regular season finals.

So, unless you're a Crows, Blues or Tigers supporter, you should be at least a smidge joyous if your team makes the pre-season final; if history's any guide, the chances are good that your team will get a ticket to the ball in September.

It's one thing to get a ticket but another thing entirely to steal the show. Pre-season finalists can, collectively, lay claim to five flags but, as a closer inspection of the previous table will reveal, four of these flags have come from just two teams, Essendon and Hawthorn. What's more, no flag has come to a pre-season finalist since the Lions managed it in 2001.

On balance then, I reckon I'd rather the team that I supported remembered that there's a "pre" in pre-season.

Sunday
Feb082009

Who Fares Best In The Draw?

Well I guess it's about time we had a look at the AFL draw for 2009.

I've summarised it in the following schematic:

The numbers show how many times a particular matchup occurs at home, away or at a neutral venue in terms of the team shown in the leftmost column. So, for example, looking at the first row, Adelaide play the Lions only once during 2009 and it's an away game for Adelaide.

For the purpose of assessing the relative difficulty of each team's schedule, I'll use the final MARS Ratings for 2008, which were as follows:

Given those, the table below shows the average MARS Rating of the opponents that each team faces at home, away and at neutral venues.

So, based solely on average opponent rating, regardless of venue, the Crows have the worst of the 2009 draw. The teams they play only once include five of the bottom six MARS-ranked teams in Brisbane (11th), Richmond (12th), Essendon (14th), West Coast (15th), Melbourne (16th). One mitigating factor for the Crows is that they tend to play stronger teams at home: they have the 2nd toughest home schedule and only the 6th toughest away and neutral-venue schedules.

Melbourne fare next worst in the draw, meeting just once four of the bottom five teams, excluding themselves. They too, however, tend to face stronger teams at home and relatively weaker teams away, though their neutral-venue schedule is also quite tough (St Kilda and Sydney).

Richmond, in contrast, get the best of the draw, avoiding a second contest with six of the top eight teams and playing each of the bottom four teams twice.

St Kilda's draw is the next best and sees them play once only four of the teams in the top eight and play each of the bottom three teams twice.

Looking a little more closely and differentiating home games from away games, we find that the Bulldogs have the toughest home schedule but also the easiest away schedule. Port Adelaide have the easiest home schedule and Sydney have the toughest away schedule.

Generally speaking, last year's finalists have fared well in the draw, with five of them having schedules ranked 10th or lower. Adelaide, Sydney and, to a lesser extent, the Bulldogs are the exceptions. It should be noted that higher-ranked teams always have a relative advantage over other teams in that their schedules exclude games against themselves. 

Friday
Feb062009

A Little AFL/VFL History

Every so often this year I'll be diving into the history of the VFL/AFL to come up with obscure and conversation-stopping facts for you to use at the next social event you attend.

For example, do you know the most common score in AFL history? It's 12.12 (84) and has been a team's final score about 0.88% of the time (counting two scores for each game in the denominator for that percentage). What if we restrict our attention to more recent seasons, say 1980 to 2008? It's 12.12 again (84), only now its prevalence is 0.98%. Last year though we managed only a single 12.12 (84) score, courtesy of St Kilda in Round 14.

While we're on the topic of scores, which season do you think produced the highest average score per team? It was 1982 and the average was 112.07 points. The trend since that season has been steadily downwards with the nadir being in 1997 when the average was 90.37 points.

From season averages to individual game scores, here are a couple of doozies. In May of 1919, Geelong took on St Kilda in a Round 5 clash at Corio Oval. The first quarter failed to produce a goal from either team and saw Geelong lead 0.6 to 0.2. St Kilda found their range - relatively speaking - in the second quarter to lead 3.4 to 0.9 at the main break. One need speculate only briefly about the thrust of the Cats' half-time speech from the coach.

The speech clearly didn't help, however, as Geelong continued to accumulate only singles for the remaining two quarters, finally emerging goal-less and defeated, 0.18 to 6.10.

Just over two years later, in July of 1921, St Kilda swapped roles and matched the Cats' ineptitude, eventually going down 0.18 to Fitzroy's 6.8 in front of around 6,000 startled fans.

If you're looking for more sustained inaccuracy you'd be after the South Melbourne team of 1900. They managed 59.127 for the entire season, a 31.7% accuracy rate.

In contrast, in 1949 the Hawks put on a spectacular display of straight kicking at Glenferrie Oval, finishing with 7.0 for the game. Regretably, their opponents, Essendon, clearly with no sense of aesthetics, repeatedly sprayed the ball at goal finishing 70 point victors by bagging a woefully inaccurate 16.16.

Again, turning from the single game to an entire season, plaudits must go to the St Kilda team of 2004, who registered 409.253 or 61.8% for the season. But, as the Hawks discovered, accuracy does not preordain success: St Kilda went out in the Preliminary Final to Port by 6 points.

Saturday
Jan312009

The Team of the Decade

Over the break I came across what must surely be amongst the simplest, most practical team rating systems.

It's based on the general premise that a team's rating should be proportional to the sum of the ratings of the teams that it has defeated. In the variant that I've used, each team's rating is proportional to the rating of those teams it has defeated on each occasion that it has faced them in a given season plus one-half of the rating of those teams with which it has drawn if they played only once, or with which it has won once and lost once if they have played twice during the season.

(Note that I've used only regular home-and-away season games for these ratings and that I've made no allowance for home team advantage.)

This method produces relative, not absolute, ratings so we can arbitrarily set any one team's rating - say the strongest team's - to be 1, and then define every other team's rating relative to this. All ratings are non-negative.

Using the system requires some knowledge of matrix algebra, but that's about it. (For the curious, the ratings involve solving the equation Ax = kx where A is a symmetric matrix with 0s on the diagonal and where Aij is the proportion of games between teams i and j that were won by i and Aji = 1 - Aij; x is the ratings vector; and k is a constant. The solution for x that we want is the first-rank eigenvector of A. We normalise x by dividing each element by the maximum element in x.)

Applying this technique to the home-and-away games of the previous 10 seasons, we obtain the following ratings:

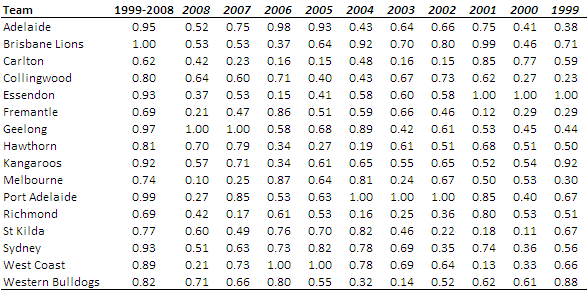
Now bear in mind that it makes little sense to directly compare ratings across seasons, so a rating of, say, 0.8 this year means only that the team was in some sense 80% as good as the best team this year; it doesn't mean that the team was any better or worse than a team rating 0.6 last year unless you're willing to make some quantitative assumption about the relative merits of this year's and last year's best teams.

What we can say with some justification however is that Geelong was stronger relative to Port in 2007 than was Geelong relative to the Hawks in 2008, The respective GFs would seem to support this assertion.

So, looking across the 10 seasons, we find that:

  • 2003 produced the greatest ratings difference between the best (Port) and second-best (Lions) teams
  • 2001 produced the smallest ratings difference between the best (Essendon) and second-best (Lions) teams
  • Carlton's drop from 4th in 2001 to 16th in 2002 is the most dramatic decline
  • Sydney's rise from 14th in 2002 to 3rd in 2003 is the most dramatic rise

Perhaps most important of all we can say that the Brisbane Lions are the Team of the Decade.

Here is the ratings table above in ranking form:

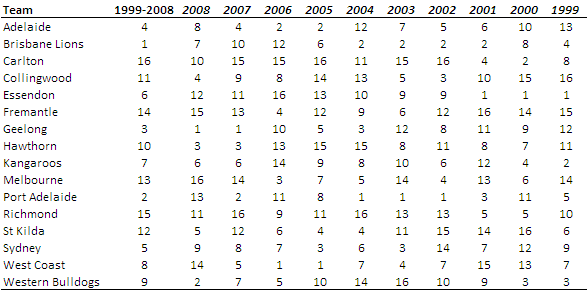
What's interesting about these rankings from a Brisbane Lions point of view is that only twice has its rating been 10th or worse. Of particular note is that, in seasons 2005 and 2008, Brisbane rates in the top 8 but did not make the finals. In 2008 the Lions won all their encounters against 3 of the finalists and shared the honours with 2 more, so there seems to be some justification for their lofty 2008 rating at least.

Put another way, based on the ratings, Brisbane should have participated in all but 2 of the past 10 final series. No other team can make that claim.

Second-best Team of the Decade is Port Adelaide, who registered 3 consecutive Highest Rated Team across seasons 2002, 2003 and 2004. Third-best is Geelong, largely due to their more recent performance, which has seen them amongst the top 5 teams in all but 1 of the previous 5 seasons.

The Worst Team of the Decade goes to Carlton, who've finished ranked 10th or below in each of the previous 7 seasons. Next worst is Richmond who have a similar record blemished only by a 9th-placed finish in 2006.

Sunday
Jan252009

Surprisals in 2009


This year we'll once again be using surprisals as a way of quantifying how unpredictable the results of each round and each team have been.
In addition to measuring the surprisal of head-to-head results, which is what we did last year, we'll also look at how surprising each result has been from a line betting point of view - a measure of how accurately the bookies have been able to predict not just the winner but the margin too.
If you're interested in the details, please download this document.


Page 1 ... 45 46 47 48 49