
;)
Another Look At Quarter-by-Quarter Performance
It's been a while since we looked at teams' quarter-by-quarter performances. This blog looks to redress this deficiency.
(By the way, the Alternative Premierships data is available as a PDF download on the MAFL Stats website .)
The table below includes each teams' percentage by quarter and its win-draw-lose record by quarter as at the end of the 14th round:
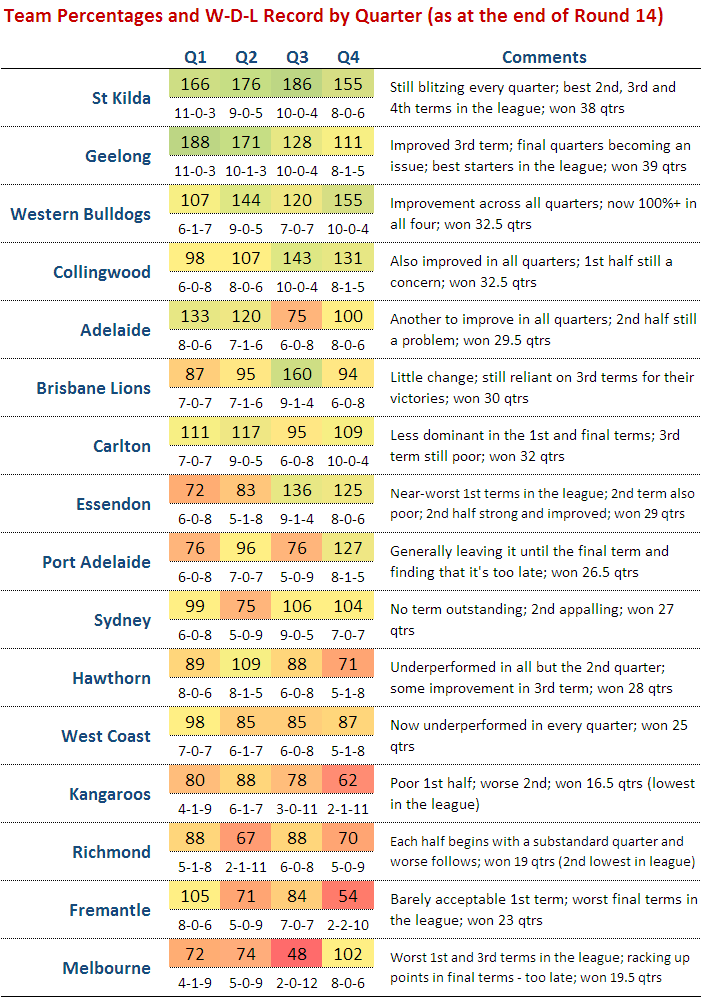
(The comments in the right-hand column in some cases make comparisons to a team's performance after Round 7. This was the subject of an earlier blog.)
Geelong, St Kilda and, to a lesser extent, Adelaide, are the kings/queens of the 1st quarter. The Cats and the Saints have both won 11 of 14 first terms, whereas the Crows, despite recording an impressive 133 percentage, have won just 8 of 14, a record that surprisingly has been matched by the 11th-placed Hawks. The Hawks however, when bad have been very, very bad, and so have a 1st quarter percentage of just 89.
Second quarters have been the province of the ladder's top 3 teams. The Saints have the best percentage (176) but the Cats have the best win-draw-lose record (10-1-3). Carlton, though 7th on the ladder, have the 5th best percentage in 2nd quarters and the equal-2nd best win-draw-lose record.
St Kilda have also dominated in the 3rd quarter racking up a league-best percentage of 186 and a 10-0-4 win-draw-lose record. Geelong and Collingwood have also established 10-0-4 records in this quarter. The Lions, though managing only a 9-1-4 win-draw-lose record, have racked up the second-best percentage in the league for this quarter (160).
Final terms, which have been far less important this year than in seasons past, have been most dominated by St Kilda and the Bulldogs in terms of percentage, and by the Dogs and Carlton in terms of win-draw-lose records.
As you'd expect, the poorer teams have tended to do poorly across all terms, though some better-positioned teams have also had troublesome quarters.
For example, amongst those teams in the ladder's top 8 or thereabouts, the Lions, the Dons and Port have all generally failed to start well, recording sub-90 percentages and 50% or worse win-draw-lose performances.
The Dons and Sydney have both struggled in 2nd terms, winning no more than 5 of them and, in the Dons' case, also drawing one.
Adelaide and Port have found 3rd terms most disagreeable, winning only, respectively, 6 and 5 of them and in so doing producing percentages of around 75.
No top-ranked team has truly flopped in the final term, though the Lions' performance is conspicuous because it has resulted in a sub-100 percentage and a 6-0-8 win-draw-lose record.
Finally, in terms of quarters won, Geelong leads on 39 followed by the Saints on 38. There's then a gap back to the Dogs and the Pies on 32.5, and then Carlton, somewhat surprisingly given its ladder position, on 32. Melbourne have only the 3rd worst performance in terms of total quarters won. They're on 19.5, ahead of Richmond on 19 and the Roos on just 16.5. That means, in an average game, the Roos can be expected to win just 1.2 quarters. Eleven of the 16.5 quarters won have come in the first half of games so, to date anyway, Roos supporters could comfortably leave at the main change without much risk of missing a winning Roos quarter or half.
 TonyC
TonyC
Reader Comments