Search MAFLOnline
Subscribe to MAFL Online


Contact Me

I can be contacted via Tony.Corke@gmail.com


Latest Information


Latest Posts
Tuesday
Sep152009

MARS Ratings of the Finalists

We've had a cracking finals series so far and there's the prospect of even better to come. Two matches that stand out from what we've already witnessed are the Lions v Carlton and Collingwood v Adelaide games. A quick look at the Round 22 MARS ratings of these teams tells us just how evenly matched they were.

Glancing down to the bottom of the 2009 column tells us a bit more about the quality of this year's finalists.

As a group, their average rating is 1,020.8, which is the 3rd highest average rating since season 2000, behind only the averages for 2001 and 2003, and weighed down by the sub-1000 rating of the eighth-placed Dons.

At the top of the 8, the quality really stands out. The top 4 teams have the highest average rating for any season since 2000, and the top 5 teams are all rated 1,025 or higher, a characteristic also unique to 2009.

Someone from among that upper eschelon had to go out in the first 2 weeks and, as we now know, it was Adelaide, making them the highest MARS rated team to finish fifth at the end of the season.

(Adelaide aren't as unlucky as the Carlton side of 2001, however, who finished 6th with a MARS Rating of 1,037.9)

Sunday
Sep132009

Updated Finals Summary

There's been a pleasing neatness to the results of the finals so far, depicted below.

Close inspection will reveal that Week 1 saw the teams from ladder positions 7 and 8 knocked out and Week 2 left those fans of the teams from positions 5 and 6 with other things to do for the rest of September. Which, of course, leaves the teams from ladder spots 1 through 4 to contest for a ticket to the Granny. All very much as it should be.

The phenomenon of the top 4 teams playing off in the Prelims has been witnessed in every season since we've had the current finals system, bar 2001 and 2007 when, in both cases, the team from 6th took the place of the team from 3rd.

The Week 2 Semi-Finals have been footballing graveyards for the teams in the bottom half of the eight, as shown in the table below.

Teams from 5th have won only 4 of 10 Elimination Finals, while teams from 8th have won the other 6. None of the winning teams have proceeded beyond the Semis.

Teams from 7th have only survived into the second week once, and this victor proceeded no further than the second week, while teams from 6th have reached the Semis on 9 occasions, losing 7 and winning just 2.

The summary of performance by ladder position across all weeks of the finals now looks like this:

Overall, teams finishing 7th have the worst finals record, winning only 1 from 11 (9%). Teams from 3rd, 4th, 5th and 8th all also have sub-50% records.

Teams finishing 6th have an 11 and 10 record, though 9 of those 11 wins have come in the Elimination Final.

And, as you might expect, teams from 1st and 2nd have the best records. Teams from 1st position have an overall 20 and 9 (69%) record, and a 10 and 5 (67%) record for the last 2 weeks of the finals. Teams from 2nd position have a slightly better overall record of 20 and 7 (74%) but a slightly worse record of 10 and 6 (63%) across the last two weeks of the finals.

Looking ahead to Week 3 of the finals I can tell you that teams from 1st have a perfect 2-0 record against teams from 3rd, and teams from 2nd have an equally perfect 4-0 record against teams from 4th.

Monday
Sep072009

The Life We Might Have Led

Though I doubt many of you are mourning the loss of the Funds that operated last year, I know I was curious to see how they would have performed had I allowed them to run around for another season.

Let me start with a comparison of last year's Recommended Portfolio with this year's:

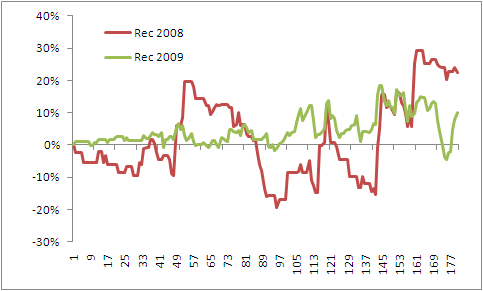
Starting with the obvious, Investors would have been happier at this point of the season - up by 22% rather than 10% - had last year's Funds and weightings been in force to create the Recommended Portfolio this year.

They'd not, however, have been in this state for all of the season, just for a period from the first game of Round 7, when Essendon beat Hawthorn and paid $5, to the first game of Round 11, and then again from the last game of Round 20, when Essendon toppled St Kilda and paid $6.50, to the present.

Interspersed with the periods of euphoria would have been long periods of despair as the Fund dropped to 80% of its value on two occasions before rebounding to its current levels. The fluctuations in the value of the 2008 Recommended Portfolio encompass a trough of almost -20% at the end of Round 8 to a peak of almost 30% at the end of Round 20. This range of about 50% contrasts starkly with that produced by this year's Recommended Portfolio, which is a range a touch less than half that amount and which includes a low point of only about -5%.

It'll be no surprise to anyone that the major cause of the dramatic fluctuations in the performance of the 2008 Recommended Portfolio would have been the Heritage Fund. In the chart below I've mapped its performance against that of the New Heritage Fund.

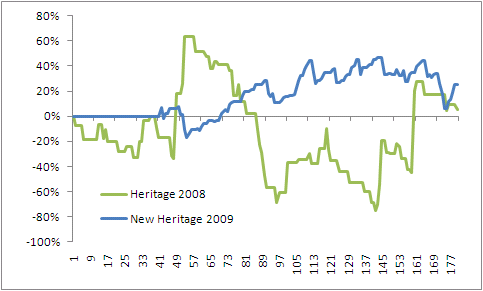
Pay close attention to the y-axis on this chart. The Heritage Fund peaks in value early in the season, climbing to +63% on the back of a lucrative wager on Freo at $3.75 who knocked off the Blues at Gold Coast Stadium, before plummeting to -69% at the end of Round 12 after a series of large and unsuccessful wagers, thereafter recovering, plummeting again and then climbing to a peak of +28% after the first game of Round 21, one game after landing the Dons at $6.50.

Also contributing to the superior performance of the 2008 Recommended Portfolio is the extraordinary success of last year's Line Fund compared to Line Redux.

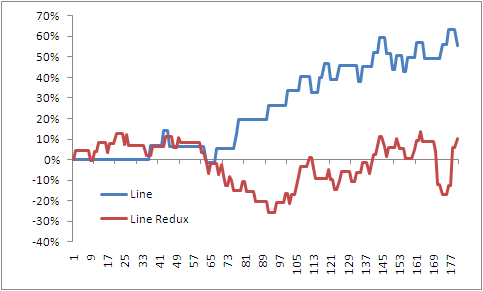
The impressive result for the Line Fund has been achieved on the basis of just 29 wagers, 19 of them successful. Line Redux, by comparison, has eked out its profit on the back of 70 wagers with just 37 of them successful, a scant 2 wins better than chance.

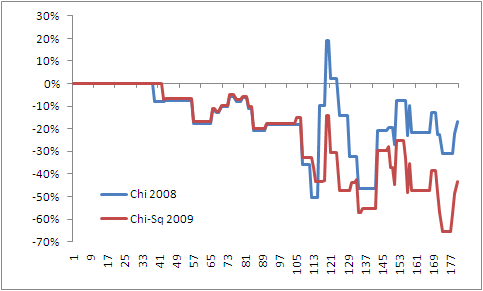
Last year's Chi Fund has also performed better than this year's Chi-squared - well, more accurately, it's performed less worse. It has even, albeit briefly, drifted into profit.

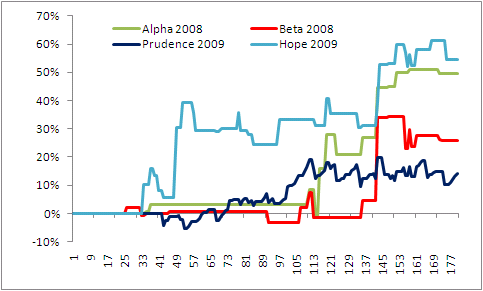
Amongst the remaining Funds, Hope has outshone them all, though Alpha and Beta have also produced solid gains. Prudence has generated consistent if unspectacular profits.


Sunday
Sep062009

A Decade of Finals

This year represents the 10th under the current system of finals, a system I think has much to recommend it. It certainly seems to - justifiably, I'd argue - favour those teams that have proven their credentials across the entire season.

The table below shows how the finals have played out over the 10 years:

This next table summarises, on a one-week-of-the-finals-at-a-time basis, how teams from each ladder position have fared:

Of particular note in relation to Week 1 of the finals is the performance of teams finishing 3rd and of those finishing 7th. Only two such teams - one from 3rd and one from 7th - have been successful in their respective Qualifying and Elimination Finals.

In the matchups of 1st v 4th and 5th v 8th the outcomes have been far more balanced. In the 1st v 4th clashes, it's been the higher ranked team that has prevailed on 6 of 10 occasions, whereas in the 5th v 8th clashes, it's been the lower ranked team that's won 60% of the time.

Turning our attention next to Week 2 of the finals, we find that the news isn't great for Adelaide or Lions fans. On both those occasions when 4th has met 5th in Week 2, the team from 4th on the ladder has emerged victorious, and on the 7 occasions that 3rd has faced 6th in Week 2, the team from 3rd on the ladder has won 5 and lost only 2.

Looking more generally at the finals, it's interesting to note that no team from ladder positions 5, 7 or 8 has made it through to the Preliminary Finals and, on the only two occasions that the team from position 6 has made it that far, none has progressed into the Grand Final.

So, teams only from positions 1 to 4 have so far contested Grand Finals, teams from 1st on 6 occasions, teams from 2nd on 7 occasions, teams from 3rd on 3 occasions, and teams from 4th only twice.

No team finishing lower than 3rd has yet won a Flag.

Monday
Aug312009

When Finalists Meet

If the teams in the finals are the best teams in the competition (and the MARS ratings say otherwise, but nonetheless) then it seems to make sense to focus on the games in which they've faced off in assessing each team's relative chances. The tables below have been constructed including just those games.

The first table provides the aggregate record of each team:

I'll come back and analyse this some more in a moment, but let me note a couple of interesting things here in passing:

  • Only 3 teams have a Percentage better than 100, and the third of them - the Dogs - only barely qualifies
  • The top 3 teams - on the ladder I've constructed here and on the competition ladder proper - met other teams in the final 8 on the fewest occasions - just 10 times each.

The second table provides summary information on the team matchups:

Now, looking at both tables together, let's consider the records of each team.

St Kilda

  • Have by far the best combined record against the other finalists, losing just 1 of 10 ten games, to the Dons in R20
  • Rank 1st on Points For and on Points Against
  • Have a Percentage almost 25 points better than any other team
  • Faced only 1 finalist in the last 5 rounds of the season

Geelong

  • Have the 2nd best combined record but it is only 6 and 4.
  • Faced 5 finalists in the second half of the season and lost 4 of them
  • Rank 2nd on Points For and 3rd on Points Against
  • Faced 3 finalists in the last 5 rounds of the season, winning 1 and losing 2
  • Have a 2 and 2 record against teams in the top 4

Western Bulldogs

  • Have a 5 and 5 record and, roughly, a Percentage of 100
  • Rank 3rd on Points For and 5th on Points Against
  • Faced only 4 finalists in the 1st half of the season, winning 1 and losing 3
  • Faced 6 finalists in the 2nd half of the season, winning 4 and losing 2
  • Faced finalists in all of the last 3 rounds and defeated them all
  • Have an 0 and 2 record against St Kilda
  • Have a 2 and 4 record against teams in the top 4

Collingwood

  • Have a 6 and 6 record and a Percentage just under 100
  • Are the only team to face 4 of the other finalists twice each
  • Rank 8th on Points For but 2nd on Points Against
  • Went 1 and 5 in the 1st half of the season, and 5 and 1 in the 2nd half
  • Faced 4 finalists in the last 6 rounds of the season, winning the first 3 - in a row, as it happpens - but losing the fourth.
  • Have a 1 and 3 record against teams in the top 4

Carlton

  • Have a 5 and 6 record and a Percentage around 90
  • Rank 4th on Points For but 8th on Points Against
  • Went 4 and 2 in the 1st half of the season, and 1 and 4 in the 2nd half
  • Faced only 3 finalists in the last 9 rounds of the season, winning only 1 of those contests
  • Have 0 and 2 records against Essendon and Adelaide
  • Have a 3 and 2 record against teams in the top 4

Essendon

  • Have a 4.5 and 6.5 record and a Percentage around 90
  • Rank 7th on Points For and on Points Against
  • Went 2 and 4 in the 1st half of the season, and 2.5 and 2.5 in the 2nd half
  • Faced only 2 finalists in the last 6 rounds of the season, winning 1 and drawing the other
  • Have a 2 and 0 record against Carlton
  • Have a 2 and 4 record against teams in the top 4

Adelaide

  • Have a 4 and 7 record and a Percentage around 90
  • Rank 5th on Points For and 6th on Points Against
  • Went 3 and 4 in the 1st half of the season, and 1 and 3 in the 2nd half
  • Have a 2 and 0 record against Carlton
  • Have a 0 and 2 record against St Kilda and against Geelong
  • Have a 1 and 6 record against teams in the top 4

Brisbane Lions

  • Have a 3.5 and 7.5 record and a Percentage around 90
  • Rank 8th on Points For but 4th on Points Against
  • Went 2 and 5 in the 1st half of the season, and 1.5 and 2.5 in the 2nd half
  • Have a 0 and 2 record against Collingwood and against Carlton
  • Have a 1 and 5 record against teams in the top 4