Search MAFLOnline
Subscribe to MAFL Online


Contact Me

I can be contacted via Tony.Corke@gmail.com


Latest Information


Latest Posts
Saturday
Mar072009

Teams' Performances Revisited

In a comment on the previous posting, Mitch asked if we could take a look at each team's performance by era, his interest sparked by the strong all-time performance of the Blues and his recollection of their less than stellar recent seasons.

Here's the data:

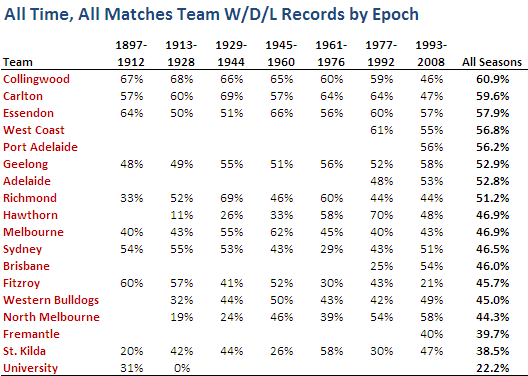
So, as you can see, Carlton's performance in the most recent epoch is significantly below its all-time performance. In fact, the 1993-2008 epoch is the only one in which the Blues failed to return a better than 50% performance.

Collingwood, the only team with a better lifetime record than Carlton, have also had a well below par last epoch during which they too have registered their first sub-50% performance, continuing a downward trend which started back in Epoch 2.

Six current teams have performed significantly better in the 1993-2008 epoch than their all-time performance: Geelong (who registered their best ever epoch), Sydney (who cracked 50% for the first time in four epochs), Brisbane (who could hardly but improve), the Western Bulldogs (who are still yet to break 50% for an epoch, their 1945-1960 figure being actually 49.5%), North Melbourne (who also registered their best ever epoch),  and St Kilda (who still didn't manage 50% for the epoch, a feat they've achieved only once).

Just before we wind up I should note that the 0% for University in Epoch 2 is not an error. It's the consequence of two 0 and 18 performances by Uni in 1913 and 1914 which, given that these followed directly after successive 1 and 17 performances in 1911 and 1912, unsurprisingly heralded the club's demise. Given that Uni's sole triumph of 1912 came in the third round, by my calculations that means University lost its final 51 matches.

Saturday
Feb282009

Teams' All-Time Records

At this time of year, before we fixate on the week-to-week triumphs and travesties of yet another AFL season, it's interesting to look at the varying fortunes of all the teams that have ever competed in the VFL/AFL.

The table below provides the Win, Draw and Loss records of every team.

As you can see, Collingwood has the best record of all the teams having won almost 61% of all the games in which it has played, a full 1 percentage point better than Carlton, in second. Collingwood have also played more games than any other team and will be the first team to have played in 2,300 games when Round 5 rolls around this year.

Amongst the relative newcomers to the competition, West Coast and Port Adelaide - and to a lesser extent, Adelaide - have all performed well having won considerably more than half of their matches.

Sticking with newcomers but dipping down to the other end of the table we find Fremantle with a particularly poor record. They've won just under 40% of their games and, remarkably, have yet to register a draw. (Amongst current teams, Essendon have recorded the highest proportion of drawn games at 1.43%, narrowly ahead of Port Adelaide with 1.42%. After Fremantle, the team with the next lowest proportion of drawn games is Adelaide at 0.24%. In all, 1.05% of games have finished with scores tied.)

Lower still we find the Saints, a further 1.3 percentage points behind Fremantle. It took St Kilda 48 games before it registered its first win in the competition, which should surely have been some sort of a hint to fans of the pain that was to follow across two world wars and a depression (maybe two). Amongst those 112 seasons of pain there's been just the sole anaesthetising flag, in 1966.

Here then are a couple of milestones that we might witness this year that will almost certainly go unnoticed elsewhere:

  • Collingwood's 2,300th game (and 1,400th win or, if the season's a bad one for them, 900th loss)
  • Carlton's 900th loss
  • West Coast's 300th win
  • Port Adelaide's 300th game
  • Geelong's and Sydney's 2,200th game
  • Adelaide's 200th loss
  • Richmond's 1,000th loss (if they fail to win more than one match all season)
  • Fremantle's 200th loss

Granted, few of those are truly banner events, but if AFL commentators were as well supported by statisticians as, say, Major League Baseball, you can bet they'd get a mention, much as equally arcane statistics are sprinkled liberally in the 3 hours of dead time there is between pitches.

Wednesday
Feb252009

Which Quarter Do Winners Win?

Today we'll revisit yet another chestnut and we'll analyse a completely new statistic.

First, the chestnut: which quarter do winning teams win most often? You might recall that for the previous four seasons the answer has been the 3rd quarter, although it was a very close run thing last season, when the results for the 3rd and 4th quarters were nearly identical.

How then does the picture look if we go back across the entire history of the VFL/AFL?

It turns out that the most recent epoch, spanning the seasons 1993 to 2008, has been one in which winning teams have tended to win more 3rd quarters than any other quarter. In fact, it was the quarter won most often in nine of those 16 seasons.

This, however, has not at all been the norm. In four of the other six epochs it has been the 4th quarter that winning teams have tended to win most often. In the other three epochs the 4th quarter has been the second most commonly won quarter.

But, the 3rd quarter has rarely been far behind the 4th, and its resurgence in the most recent epoch has left it narrowly in second place in the all-time statistics.

A couple of other points are worth making about the table above. Firstly, it's interesting to note how significantly more frequently winning teams are winning the 1st quarter than they have tended to in epochs past. Successful teams nowadays must perform from the first bounce.

Secondly, there's a clear trend over the past 4 epochs for winning teams to win a larger proportion of all quarters, from about 66% in the 1945 to 1960 epoch to almost 71% in the 1993 to 2008 epoch.

Now on to something a little different. While I was conducted the previous analysis, I got to wondering if there'd ever been a team that had won a match in which in had scored more points than its opponent in just a solitary quarter. Incredibly, I found that it's a far more common occurrence than I'd have estimated.

The red line shows, for every season, the percentage of games in which the winner won just a solitary quarter (they might or might not have drawn any of the others). The average percentage across all 112 seasons is 3.8%. There were five such games last season, in four of which the winner didn't even manage to draw any of the other three quarters. One of these games was the Round 19 clash between Sydney and Fremantle in which Sydney lost the 1st, 2nd and 4th quarters but still got home by 2 points on the strength of a 6.2 to 2.5 3rd term.

You can also see from the chart the upward trend since about the mid 1930s in the percentage of games in which the winner wins all four quarters, which is consistent with the general rise, albeit much less steadily, in average victory margins over that same period that we saw in an earlier blog.

To finish, here's the same data from the chart above summarised by epoch:


Monday
Feb162009

Is the Competition Getting More Competitive?

We've talked before about the importance of competitiveness in the AFL and the role that this plays in retaining fans' interest because they can legitimately believe that their team might win this weekend (Melbourne supporters aside).

Last year we looked at a relatively complex measure of competitiveness that was based on the notion that competitive balance should produce competition ladders in which the points are spread across teams rather than accruing disproportionately to just a few. Today I want to look at some much simpler diagnostics based on margins of victory.

Firstly, let's take a look at the average victory margin per game across every season of the VFL/AFL.

The trend since about the mid 1950s has been increasing average victory margins, though this seems to have been reversed at least a little over the last decade or so. Notwithstanding this reversal, in historical terms, we saw quite high average victory margins in 2008. Indeed, last year's average margin of 35.9 points was the 21st highest of all time.

Looking across the last decade, the lowest average victory margin came in 2002 when it was only 31.7 points, a massive 4 points lower than we saw last year. Post WWII, the lowest average victory margin was 23.2 points in 1957, which was the season in which Melbourne took the minor premiership with 12-1-5 record.

Averages can, of course, be heavily influenced by outliers, in particular by large victories. One alternative measure of the closeness of games that avoids these outliers is the proportion of games that are decided by less than a goal or two. The following chart provides information about such measures. (The purple line shows the percentage of games won by 11 points or fewer and the green line shows the percentage of games won by 5 points or fewer. Both include draws.)

Consistent with what we found in the chart of average victory margins we can see here a general trend towards fewer close games since about the mid 1950s. We can also see an increase in the proportion of close games in the last decade.

Again we also find that, in historical terms, the proportion of close games that we're seeing is relatively low. The proportion of games that finished with a margin of 5 points or fewer in 2008 was just 10.8%, which ranks equal 66th (from 112 seasons). The proportion that finished with a margin of 11 points or fewer was just 21.1%, which ranks an even lowlier 83rd.

On balance then I think you'd have to conclude that the AFL competition is not generally getting closer though there are some signs that the situation has been improving in the last decade or so.

Thursday
Feb122009

Winners' Share of Scoring

You might recall from seasons past my commenting on what I've claimed to be a startling regularity in AFL scoring, specifically, the proportion of scoring shots recorded by winning teams.

In 2008, winning teams racked up 57.3% of all scoring shots, while in 2007 the figure was 56.6%, and in 2006 it was 56.7%. Across the period 1999 to 2008 this percentage bounced around in a range between 56.4% and 57.8%. By any standard that's remarkable regularity.

I've recently come into possession of the scores for the entire history of the VFL/AFL competition in a readily analysable form - and by now you surely now how dangerous that's gotta be - so it seemed only natural to see if this regularity persisted into earlier seasons (assuming that it makes sense for something to persist into the past).

Below is a chart showing (in purple) the percentage of scoring shots registered by winning teams in each of the seasons 1897 through 2008. (The red line shows the proportion of goals that they scored, and the green line shows the proportion of behinds.)

So, apart from the more extreme dominance of winning teams in the first decade or so of the competition, and a few other aberrant seasons over the next two decades, we have certainly seen remarkable stability in the percentage we've been discussing. Indeed, in the period 1927 to 2008, the percentage of scoring shots registered by winning teams has never been outside the range 55.0% to 59.6%. That surely almost establishes this phenomenon as a Law of Footy.

For those of you who prefer to digest your data in tabular form (preferably taken with meals), here's a decade-by-decade summary of the data.

The recent peak in winning teams' share of scoring was witnessed in 1995 and it came not as a consequence of a spike in 6-pointer dominance but instead from a spike in winning teams' share of behinds. In 1995 winning teams scored 57% of all behinds, which is about 2-4% higher than anything we've witnessed since. 1995 was the year that Carlton won the minor premiership kicking 317 behinds, Geelong finished runners-up kicking 338, and Richmond and Essendon, finishing in 3rd and 4th, kicked 600 more between them. By way of context, that's almost 75 more behinds than the top 4 of Geelong, Hawthorn, Western Bulldogs and St Kilda managed in 2008.

Regularity also aptly describes the history of the percentage of goals kicked by winning teams across the seasons (the red line in the chart). Again looking at the entire period since 1927, this percentage has never strayed from the righteous range of 57.0% to 61.8%.

Winning teams' share of behinds (the green line) has been, relatively speaking, quite variable, ranging from 51.9% to 58.2% in the period 1927 to the present, which once again demonstrates that it's goals and not behinds that win footy games.