
;)
Final Ladder Positions and Team's Flag Prospects After Round 21
The teams that will comprise the final 8 are now determined - barring Lazarian performances - but their final order is not.
Here's what the latest simulations show about each team's likely ladder finish:
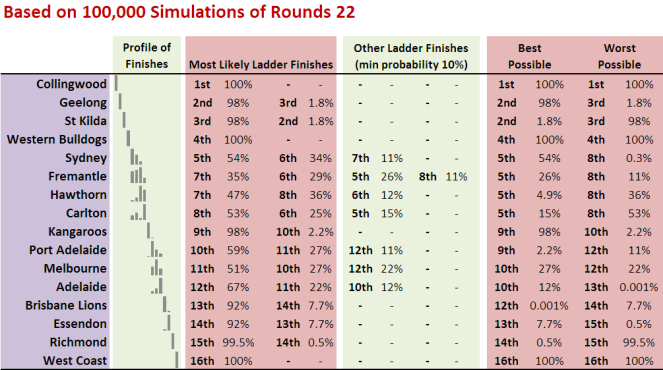
With no real interest in who'll make the eight, I wondered instead how much it matters if, say, Sydney finishes 7th rather than 5th?
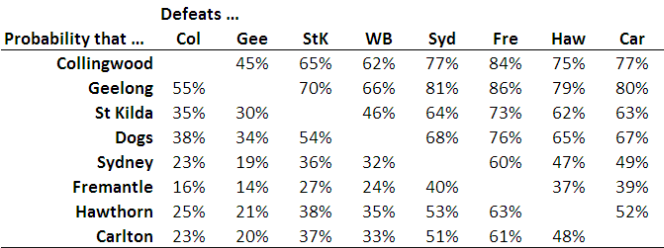
To answer this question I needed a probability matrix showing, for example possible pairing of teams in the 8, the probability of victory for each team. To create this matrix I used the current MARS Ratings for each team and the following equation:
Probability of Victory = exp((0.712*(Own MARS Rating - Opponent's MARS Rating))/22.3) / (1+exp((0.712*(Own MARS Rating - Opponent's MARS Rating))/22.3))
This equation is based on equations I derived in earlier blogs and, importantly, assumes that there is no home ground advantage in the finals. It provides this probability matrix:
In the 100,000 simulations used to create the first chart there were only eight relatively likely finishing orders for the top 8 teams. For the next round of simulations I played out the 4 weeks of the finals 100,000 times for each of these eight finishing orders and recorded which team won the Grand Final in each simulation.
The results of this are summarised in the table below. As you move down the rows the relative likelihood of that particular set of ladder positions shrinks, from about 27% for the top row (which, as well as being the most likely finishing order is also the current order) to about 1% for the bottom row.
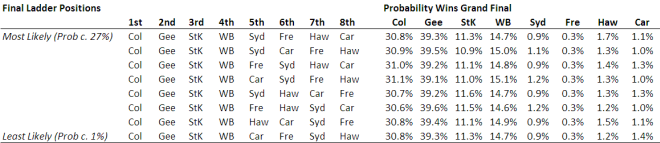
What's startling about this table is how little variability there is across the rows - these simulation results suggest that, this season, a team's finishing order will have very little impact on its absolute prospects of winning the flag.
Roughly speaking, Geelong are about a 39% chance of winning the flag, Collingwood are at about 31%, St Kilda's about 11%, the Dogs about 15%, and the rest are all around 0.5-1.5% each.
The lack of variability between the rows, I'd suggest, is largely because positions 1 to 4 are already determined - so there's no source of variability there - and because the teams in positions 5 to 8, based on their relative MARS Ratings, have little chance of toppling the teams above them. None of the teams in positions 5 to 8 has a probability greater than 38% of defeating a team from the top 4 even once, so doing it two or three times - which is what they'll need to do to win the flag - seems very unlikely.
If you believe these simulations, then the fair value prices are as follows (the current TAB Sportsbet prices are in brackets and any value bets are in bold):
- Collingwood $3.25 ($3)
- Geelong $2.55 ($2.50)
- St Kilda $8.95 ($5)
- Bulldogs $6.75 ($9)
- Sydney $101 ($26)
- Fremantle $336 ($51)
- Hawthorn $74 ($15)
- Carlton $87 ($51)
So, only the Dogs at $9 offer any value.
 TonyC
TonyC
Reader Comments