
;)
Monday
Aug022010
MAFL 2010 : Team Dashboard for Round 18
The MAFL Team Dashboard for Round 18 is below.
Here are a few statistical highlights for each team chosen because the statistic illuminates sustained performance is at the extremes or anomalous performance relative to a team's ladder position:
Collingwood
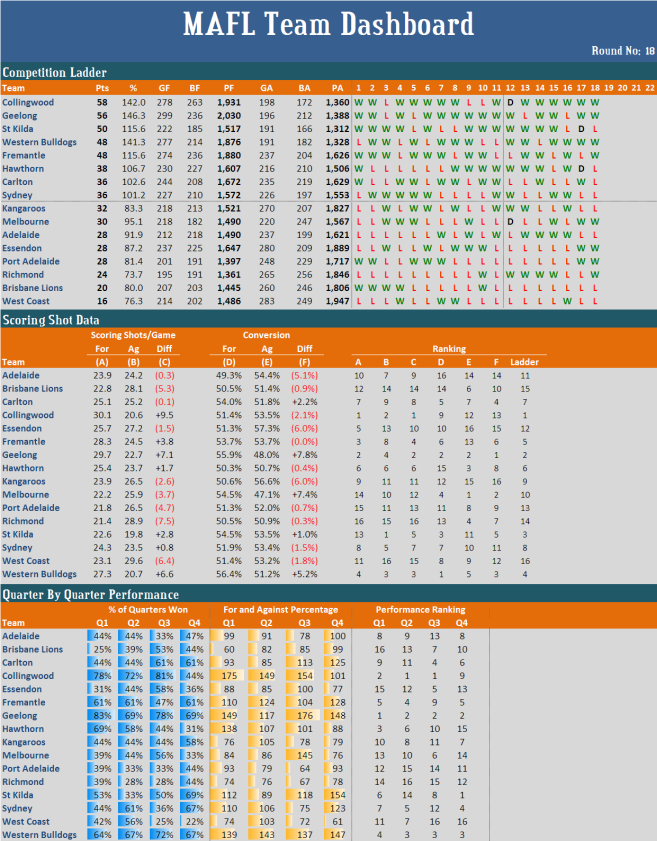
- Kicked 2nd most goals (278)
- Kicked most behinds (263)
- Have the 2nd best percentage (142.0)
- Ranked 12th on opponent conversion rate (53.5%)
- Ranked 9th on Q4 performances (44% of quarters won, 101 percentage)
- Kicked most goals (299) and most total points (2,030)
- Only team to have kicked 2,000 points in the season
- Have the best percentage (146.3)
- Ranked 1st or 2nd for performances in every match quarter
- Kicked fewest goals of any team in the top 8 (222)
- Conceded fewest goals of any team in the competition (191, level with the Dogs) and fewest total points (1,312)
- Ranked 13th on scoring shots per game (22.6) but 1st on opponent scoring shots per game (19.8)
- Ranked 14th on Q2 performances (33% of quarters won, 89 percentage) and 1st on Q4 performances (69% of quarters won, 154 percentage)
- Conceded fewest goals of any team (191, level with the Saints) and 2nd fewest total points (1,328)
- Ranked 1st on conversion rate (56.4%)
- Ranked 1st on 'team most difficult to comment about' metric (aeq with the Roos - 2 comments ... well, now 3)
- Conceded the most goals of any team in the top 8 (237)
- Ranked 3rd on scoring shots per game (28.3)
- Ranked 13th on opponent conversion rate (53.7%)
- Ranked 9th on Q3 performances (47% of quarters won, 104 percentage)
- Kicked only 3 more goals than behinds (230 vs 227)
- Ranked 15th on conversion rate (50.3%) but 3rd on opponent conversion rate (50.7%)
- Ranking of match quarter performances declines from earlier to later quarters: ranked 3rd for Q1 performances and 15th for Q4 performances
- Conceded most behinds of any team in the top 8 (219) and 2nd most goals (235)
- Worst record for 2nd half of season of any team in the top 8 (2-5)
- Have a better than 100 percentage for Q3 and Q4 and a worse than 100 percentage for Q1 and Q2
- Worst percentage of any team in the top 8 (101.2)
- Ranked 5th on opponent scoring shots per game (23.5)
- Ranked 12th on Q3 performances (36% of quarters won, 75 percentage) and 4th on Q4 performances (67% of quarters won, 123 percentage)
- Worst percentage of any team in the top 12 (83.3)
- Ranked 15th on opponent conversion rate (56.6%)
- Ranked 1st on 'team most difficult to comment about' metric (aeq with the Dogs)
- Conceded most behinds of any team in the top 13 (247)
- Better record for 2nd half of season than the three teams above them on the ladder
- Ranked 1st on opponent conversion rate (47.1%) and 4th on own conversion rate (54.5%)
- Ranked 14th on scoring shots per game (22.2)
- Ranked 6th on Q3 performances (56% of quarters won, 145 percentage)
- Better record for 2nd half of season than the four teams above them on the ladder
- Worst conversion rate of any team (49.3%)
- Ranked 13th on Q3 performances
- Have lost more than they've won of every match quarter
- Kicked the most goals of any team not in the top 8 (237), the most behinds (225) and the most points (1,647)
- Conceded the most goals of any team (280) and the most points (1,889)
- Ranked 5th on scoring shots per game (25.7)
- Ranked last on opponent conversion rate (57.3%)
- Ranked 5th on Q3 performances (58% of quarters won, 100 percentage)
- Kicked the 2nd fewest number of goals of any team (201) and the 2nd fewest total points (1,397)
- Ranked 15th on scoring shots per game (22.2)
- Ranked 15th on Q2 performances (33% of quarters won, 79 percentage)
- Kicked the fewest goals of any team (195) and the fewest total points (1,361)
- Have the worst percentage of any team (73.7)
- Better record for 2nd half of season than the nine teams above them on the ladder
- Ranked 4th on opponent conversion rate (50.9%)
- Ranked last on scoring shots per game (21.4) and 2nd last on opponent scoring shots per game (28.9)
- Ranked 16th on Q2 performances (28% of quarters won, 76 percentage) and 15th on Q3 performances (28% of quarters won, 67 percentage)
- Only team not to have recorded a win in the 2nd half of the season
- Ranked 6th on opponent conversion rate (51.4%)
- Have the worst Q1 performance of any team (25% of quarters won, 60 percentage)
- Kicked within 5 goals of the 7 teams above them on the ladder excluding Essendon
- Conceded the most goals of any team (283) and the most points (1,947)
- Ranked 8th on conversion rate (51.4%) and 9th on opponent conversion rate (53.2%)
- Ranked 7th on Q2 performances (56% of quarters won, 103 percentage), but last on Q3 performances (25% of quarters won, 72 percentage) and Q4 performances (22% of quarters won, 61 percentage)
 TonyC
TonyC
Reader Comments