Search MAFLOnline
Subscribe to MAFL Online


Contact Me

I can be contacted via Tony.Corke@gmail.com


Latest Information


Latest Posts
Sunday
Sep192010

Pies v Saints: An Initial Prediction

During the week I'm sure I'll have a number of attempts at predicting the result of the Grand Final - after all, the more predictions you make about the same event, the better your chances of generating at least one that's remembered for its accuracy, long after the remainder have faded from memory.

In this brief blog the entrails I'll be contemplating come from a review of the relationship between Grand Finalists' MARS Ratings and the eventual result for each of the 10 most recent Grand Finals.

Firstly, here's the data:

In seven of the last 10 Grand Finals the team with the higher MARS Rating has prevailed. You can glean this from the fact that the rightmost column contains only three negative values indicating that the team with the higher MARS Rating scored fewer points in the Grand Final than the team with the lower MARS Rating.

What this table also reveals is that:

  • Collingwood are the highest-rated Grand Finalist since Geelong in 2007 (and we all remember how that Grand Final turned out)
  • St Kilda are the lowest-rated Grand Finalist since Port Adelaide in 2007 (refer previous parenthetic comment)
  • Only one of the three 'upset' victories from the last decade, where upset is defined based on MARS Ratings, was associated with a higher MARS Rating differential. This was the Hawks' victory over Geelong in 2008 when the Hawks' MARS Rating was almost 29 points less than the Cats'

From the raw data alone it's difficult to determine if there's much of a relationship between the Grand Finalists' MARS Ratings and their eventual result. Much better to use a chart:

The dots each represent a single Grand Final and the line is the best fitting linear relationship between the difference in MARS Ratings and the eventual Grand Final score difference. As well as showing the line, I've also included the equation that describes it, which tells us that the best linear predictor of the Grand Final margin is that the team with the higher MARS Rating will win by a margin equal to about 1.06 times the difference in the teams' MARS Ratings less a bit under 1 point.

For this year's Grand Final that suggests that Collingwood will win by 1.062 x 26.1 - 0.952, which is just under 27 points. (I've included this in gray in the table above.)

One measure of the predictive power of the equation I've used here is the proportion of variability in Grand Final margins that it's explained historically. The R-squared of 0.172 tells us that this proportion is about 17%, which is comforting without being compelling.

We can also use a model fitted to the last 10 Grand Finals to create what are called confidence intervals for the final result. For example, we can say that there's a 50% chance that the result of the Grand Final will be in the range spanning a 5-point loss for the Pies to a 59-point win, which demonstrates just how difficult it is to create precise predictions when you've only 10 data points to play with.

Saturday
Sep182010

Visualising AFL Grand Final History

I'm getting in early with the Grand Final postings.

The diagram below summarises the results of all 111 Grand Finals in history, excluding the drawn Grand Finals of 1948 and 1977, and encodes information in the following ways:

  • Each circle represents a team. Teams can appear once or twice (or not at all) - as a red circle as Grand Final losers and as a green circle as Grand Final winners.
  • Circle size if proportional to frequency. So, for example, a big red circle, such as Collingwood's denotes a team that has lost a lot of Grand Finals.
  • Arrows join Grand Finalists and emanate from the winning team and terminate at the losing team. The wider the arrow, the more common the result.

No information is encoded in the fact that some lines are solid and some are dashed. I've just done that in an attempt to improve legibility. (You can get a PDF of this diagram here, which should be a little easier to read.)

I've chosen not to amalgamate the records of Fitzroy and the Lions, Sydney and South Melbourne, or Footscray and the Dogs (though this last decision, I'll admit, is harder to detect). I have though amalgamated the records of North Melbourne and the Roos since, to my mind, the difference there is one of name only.

The diagram rewards scrutiny. I'll just leave you with a few things that stood out for me:

  • Seventeen different teams have been Grand Final winners; sixteen have been Grand Final losers
  • Wins have been slightly more equitably shared around than losses: eight teams have pea-sized or larger green circles (Carlton, Collingwood, Essendon, Hawthorn, Melbourne, Richmond, Geelong and Fitzroy), six have red circles of similar magnitude (Collingwood, South Melbourne, Richmond, Carlton, Geelong and Essendon).
    I recognise that my vegetable-based metric is inherently imprecise and dependent on where you buy your produce and whether it's fresh or frozen, but I feel that my point still stands.
  • You can almost feel the pain radiating from those red circles for the Pies, Dons and Blues. Pies fans don't even have the salve of a green circle of anything approaching compensatory magnitude.
  • Many results are once-only results, with the notable exceptions being Richmond's dominance over the Blues, the Pies' over Richmond, and the Blues over the Pies (who knew - football Grand Final results are intransitive?), as well as Melbourne's over the Dons and the Pies.

As I write this, the Saints v Dogs game has yet to be played, so we don't know who'll face Collingwood in the Grand Final.

If it turns out to be a Pies v Dogs Grand Final then we'll have nothing to go on, since these two teams have not previously met in a Grand Final, not even if we allow Footscray to stand-in for the Dogs.

A Pies v Saints Grand Final is only slightly less unprecedented. They've met once before in a Grand Final when the Saints were victorious by one point in 1966.

Thursday
Sep162010

A Proposition Bet on the Game Margin

We've not had a proposition bet for a while, so here's the bet and a spiel to go with it:

"If the margin at quarter time is a multiple of 6 points I'll pay you $5; if it's not, you pay me a $1. If the two teams are level at quarter-time it's a wash and neither of us pay the other anything.

Now quarter-time margins are unpredictable, so the probability of the margin being a multiple of 6 is 1-in-6, so my offering you odds of 5/1 makes it a fair bet, right? Actually, since goals are worth six points, you've probably got the better of the deal, since you'll collect if both teams kick the same number of behinds in the quarter.

Deal?"

At first glance this bet might look reasonable, but it isn't. I'll take you through the mechanics of why, and suggest a few even more lucrative variations.

Firstly, taking out the drawn quarter scenario is important. Since zero is divisible by 6 - actually, it's divisible by everything but itself - this result would otherwise be a loser for the bet proposer. Historically, about 2.4% of games have been locked up at the end of the 1st quarter, so you want those games off the table.

You could take the high moral ground on removing the zero case too, because your probability argument implicitly assumes that you're ignoring zeroes. If you're claiming that the chances of a randomly selected number being divisible by 6 is 1-in-6 then it's as if you're saying something like the following:

"Consider all the possible margins of 12 goals or less at quarter time. Now twelve of those margins - 6, 12, 18, 24, 30, 36, 42, 48, 54, 60, 66 and 72 - are divisible by 6, and the other 60, excluding 0, are not. So the chances of the margin being divisible by 6 are 12-in-72 or 1-in-6."

In running that line, though, I'm making two more implicit assumptions, one fairly obvious and the other more subtle.

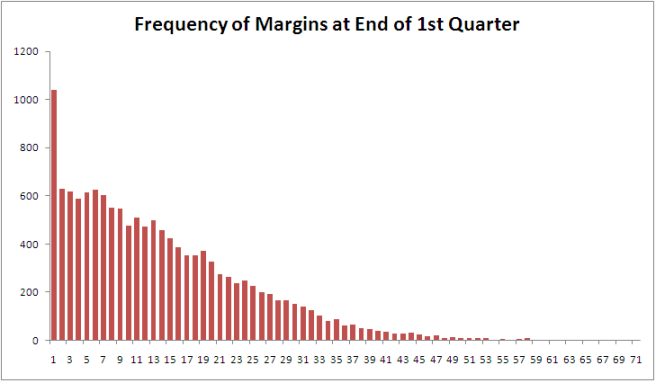
The obvious assumption I'm making is that every margin is equally likely. Demonstrably, it's not. Smaller margins are almost universally more frequent than larger margins. Because of this, the proportion of games with margins of 1 to 5 points is more than 5 times larger than the proportion of games with margins of exactly 6 points, the proportion of games with margins of 7 to 11 points is more than 5 times larger than the proportion of games with margins of exactly 12 points, and so on. It's this factor that, primarily, makes the bet profitable.

The tendency for higher margins to be less frequent is strong, but it's not inviolate. For example, historically more games have had a 5-point margin at quarter time than a 4-point margin, and more have had an 11-point margin than a 10-point margin. Nonetheless, overall, the declining tendency has been strong enough for the proposition bet to be profitable as I've described it.

Here is a chart of the frequency distribution of margins at the end of the 1st quarter.

The far-less obvious assumption in my earlier explanation of the fairness of the bet is that the bet proposer will have exactly five-sixths of the margins in his or her favour; he or she will almost certainly have more than this, albeit only slightly more.

This is because there'll be a highest margin and that highest margin is more likely not to be divisible by 6 than it is to be divisible by 6. The simple reason for this is, as we've already noted, that only one-sixth of all numbers are divisible by six.

So if, for example, the highest margin witnessed at quarter-time is 71 points (which, actually, it is), then the bet proposer has 60 margins in his or her favour and the bet acceptor has only 11. That's 5 more margins in the proposer's favour than the 5/1 odds require, even if every margin was equally likely.

The only way for the ratio of margins in favour of the proposer to those in favour of the acceptor to be exactly 5-to-1 would be for the highest margin to be an exact multiple of 6. In all other cases, the bet proposer has an additional edge (though to be fair it's a very, very small one - about 0.02%).

So why did I choose to settle the bet at the end of the 1st quarter and not instead, say, at the end of the game?

Well, as a game progresses the average margin tends to increase and that reduces the steepness of the decline in frequency with increasing margin size.

Here's the frequency distribution of margins as at game's end.


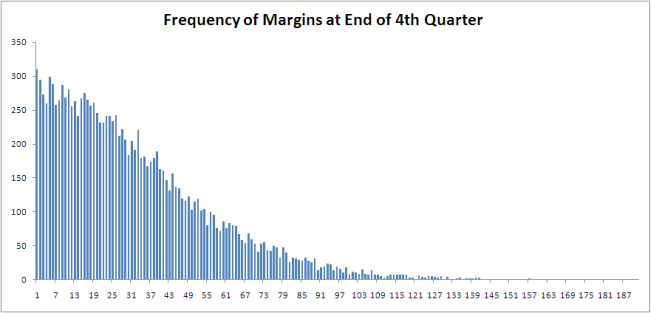
(As well as the shallower decline in frequencies, note how much less prominent the 1-point game is in this chart compared to the previous one. Games that are 1-point affairs are good for the bet proposer.)

The slower rate of decline when using 4th-quarter rather than 1st-quarter margins makes the wager more susceptible to transient stochastic fluctuations - or what most normal people would call 'bad luck' - so much so that the wager would have been unprofitable in just over 30% of the 114 seasons from 1897 to 2010, including a horror run of 8 losing seasons in 13 starting in 1956 and ending in 1968.

Across all 114 seasons taken as a whole though it would also have been profitable. If you take my proposition bet as originally stated and assume that you'd found a well-funded, if a little slow and by now aged, footballing friend who'd taken this bet since the first game in the first round of 1897, you'd have made about 12c per game from him or her on average. You'd have paid out the $5 about 14.7% of the time and collected the $1 the other 85.3% of the time.

Alternatively, if you'd made the same wager but on the basis of the final margin, and not the margin at quarter-time, then you'd have made only 7.7c per game, having paid out 15.4% of the time and collected the other 84.6% of the time.

One way that you could increase your rate of return, whether you choose the 1st- or 4th-quarter margin as the basis for determining the winner, would be to choose a divisor higher than 6. So, for example, you could offer to pay $9 if the margin at quarter-time was divisible by 10 and collect $1 if it wasn't. By choosing a higher divisor you virtually ensure that there'll be sufficient decline in the frequencies that your wager will be profitable.

In this last table I've provided the empirical data for the profitability of every divisor between 2 and 20. For a divisor of N the bet is that you'll pay $N-1 if the margin is divisible by N and you'll receive $1 if it isn't. The left column shows the profit if you'd settled the bet at quarter-time, and the right column if you'd settled it all full-time.


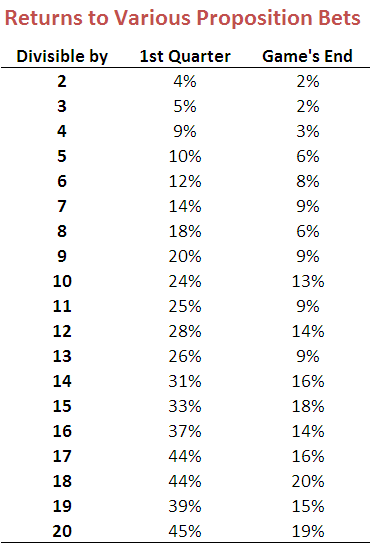
As the divisor gets larger, the proposer benefits from the near-certainty that the frequency of an exactly-divisible margin will be smaller than what's required for profitability; he or she also benefits more from the "extra margins" effect since there are likely to be more of them and, for the situation where the bet is being settled at quarter-time, these extra margins are more likely to include a significant number of games.

Consider, for example, the bet for a divisor of 20. For that wager, even if the proportion of games ending the quarter with margins of 20, 40 or 60 points is about one-twentieth the total proportion ending with a margin of 60 points or less, the bet proposer has all the margins from 61 to 71 points in his or her favour. That, as it turns out, is about another 11 games, or almost 0.1%. Every little bit helps.

Tuesday
Sep142010

All You Ever Wanted to Know About Favourite-Longshot Bias ...

Previously, on at least a few occasions, I've looked at the topic of the Favourite-Longshot Bias and whether or not it exists in the TAB Sportsbet wagering markets for AFL.

A Favourite-Longshot Bias (FLB) is said to exist when favourites win at a rate in excess of their price-implied probability and longshots win at a rate less than their price-implied probability. So if, for example, teams priced at $10 - ignoring the vig for now - win at a rate of just 1 time in 15, this would be evidence for a bias against longshots. In addition, if teams priced at $1.10 won, say, 99% of the time, this would be evidence for a bias towards favourites.

When I've considered this topic in the past I've generally produced tables such as the following, which are highly suggestive of the existence of such an FLB.

Each row of this table, which is based on all games from 2006 to the present, corresponds to the results for teams with price-implied probabilities in a given range. The first row, for example, is for all those teams whose price-implied probability was less than 10%. This equates, roughly, to teams priced at $9.50 or more. The average implied probability for these teams has been 9%, yet they've won at a rate of only 4%, less than one-half of their 'expected' rate of victory.

As you move down the table you need to arrive at the second-last row before you come to one where the win rate exceed the expected rate (ie the average implied probability). That's fairly compelling evidence for an FLB.

This empirical analysis is interesting as far as it goes, but we need a more rigorous statistical approach if we're to take it much further. And heck, one of the things I do for a living is build statistical models, so you'd think that by now I might have thrown such a model at the topic ...

A bit of poking around on the net uncovered this paper which proposes an eminently suitable modelling approach, using what are called conditional logit models.

In this formulation we seek to explain a team's winning rate purely as a function of (the natural log of) its price-implied probability. There's only one parameter to fit in such a model and its value tells us whether or not there's evidence for an FLB: if it's greater than 1 then there is evidence for an FLB, and the larger it is the more pronounced is the bias.

When we fit this model to the data for the period 2006 to 2010 the fitted value of the parameter is 1.06, which provides evidence for a moderate level of FLB. The following table gives you some idea of the size and nature of the bias.

The first row applies to those teams whose price-implied probability of victory is 10%. A fair-value price for such teams would be $10 but, with a 6% vig applied, these teams would carry a market price of around $9.40. The modelled win rate for these teams is just 9%, which is slightly less than their implied probability. So, even if you were able to bet on these teams at their fair-value price of $10, you'd lose money in the long run. Because, instead, you can only bet on them at $9.40 or thereabouts, in reality you lose even more - about 16c in the dollar, as the last column shows.

We need to move all the way down to the row for teams with 60% implied probabilities before we reach a row where the modelled win rate exceeds the implied probability. The excess is not, regrettably, enough to overcome the vig, which is why the rightmost entry for this row is also negative - as, indeed, it is for every other row underneath the 60% row.

Conclusion: there has been an FLB on the TAB Sportsbet market for AFL across the period 2006-2010, but it hasn't been generally exploitable (at least to level-stake wagering).

The modelling approach I've adopted also allows us to consider subsets of the data to see if there's any evidence for an FLB in those subsets.

I've looked firstly at the evidence for FLB considering just one season at a time, then considering only particular rounds across the five seasons.

So, there is evidence for an FLB for every season except 2007. For that season there's evidence of a reverse FLB, which means that longshots won more often than they were expected to and favourites won less often. In fact, in that season, the modelled success rate of teams with implied probabilities of 20% or less was sufficiently high to overcome the vig and make wagering on them a profitable strategy.

That year aside, 2010 has been the year with the smallest FLB. One way to interpret this is as evidence for an increasing level of sophistication in the TAB Sportsbet wagering market, from punters or the bookie, or both. Let's hope not.

Turning next to a consideration of portions of the season, we can see that there's tended to be a very mild reverse FLB through rounds 1 to 6, a mild to strong FLB across rounds 7 to 16, a mild reverse FLB for the last 6 rounds of the season and a huge FLB in the finals. There's a reminder in that for all punters: longshots rarely win finals.

Lastly, I considered a few more subsets, and found:

  • No evidence of an FLB in games that are interstate clashes (fitted parameter = 0.994)
  • Mild evidence of an FLB in games that are not interstate clashes (fitted parameter = 1.03)
  • Mild to moderate evidence of an FLB in games where there is a home team (fitted parameter = 1.07)
  • Mild to moderate evidence of a reverse FLB in games where there is no home team (fitted parameter = 0.945)

FLB: done.

Tuesday
Sep142010

Divining the Bookie Mind: Singularly Difficult

It's fun this time of year to mine the posted TAB Sportsbet markets in an attempt to glean what their bookie is thinking about the relative chances of the teams in each of the four possible Grand Final pairings.

Three markets provide us with the relevant information: those for each of the two Preliminary Finals, and that for the Flag.

From these markets we can deduce the following about the TAB Sportsbet bookie's current beliefs (making my standard assumption that the overround on each competitor in a contest is the same, which should be fairly safe given the range of probabilities that we're facing with the possible exception of the Dogs in the Flag market):

  • The probability of Collingwood defeating Geelong this week is 52%
  • The probability of St Kilda defeating the Dogs this week is 75%
  • The probability of Collingwood winning the Flag is about 34%
  • The probability of Geelong winning the Flag is about 32%
  • The probability of St Kilda winning the Flag is about 27%
  • The probability of the Western Bulldogs winning the Flag is about 6%

(Strictly speaking, the last probability is redundant since it's implied by the three before it.)

What I'd like to know is what these explicit probabilities imply about the implicit probabilities that the TAB Sportsbet bookie holds for each of the four possible Grand Final matchups - that is for the probability that the Pies beat the Dogs if those two teams meet in the Grand Final; that the Pies beat the Saints if, instead, that pair meet; and so on for the two matchups involving the Cats and the Dogs, and the Cats and the Saints.

It turns out that the six probabilities listed above are insufficient to determine a unique solution for the four Grand Final probabilities I'm after - in mathematical terms, the relevant system that we need to solve is singular.

That system is (approximately) the following four equations, which we can construct on the basis of the six known probabilities and the mechanics of which team plays which other team this week and, depending on those results, in the Grand Final: 

  • 52% x Pr(Pies beat Dogs) + 48% x Pr(Cats beat Dogs) = 76%
  • 52% x Pr(Pies beat Saints) + 48% x Pr(Cats beat Saints) = 63.5%
  • 75% x Pr(Pies beat Saints) + 25% x Pr(Pies beat Dogs) = 66%
  • 75% x Pr(Cats beat Saints) + 25% x Pr(Cats beat Dogs) = 67.5%

(If you've a mathematical bent you'll readily spot the reason for the singularity in this system of equations: the coefficients in every equation sum to 1, as they must since they're complementary probabilities.)

Whilst there's not a single solution to those four equations - actually there's an infinite number of them, so you'll be relieved to know that I won't be listing them all here - the fact that probabilities must lie between 0 and 1 puts constraints on the set of feasible solutions and allows us to bound the four probabilities we're after.

So, I can assert that, as far as the TAB Sportsbet bookie is concerned:

  • The probability that Collingwood would beat St Kilda if that were the Grand Final matchup - Pr(Pies beats Saints) in the above - is between about 55% and 70%
  • The probability that Collingwood would beat the Dogs if that were the Grand Final matchup is higher than 54% and, of course, less than or equal to 100%.
  • The probability that Geelong would beat St Kilda if that were the Grand Final matchup is between 57% and 73%
  • The probability that Geelong would beat the Dogs if that were the Grand Final matchup is higher than 50.5% and less than or equal to 100%.

One straightforward implication of these assertions is that the TAB Sportsbet bookie currently believes the winner of the Pies v Cats game on Friday night will start as favourite for the Grand Final. That's an interesting conclusion when you recall that the Saints beat the Cats in week 1 of the Finals.

We can be far more definitive about the four probabilities if we're willing to set the value of any one of them, as this then uniquely defines the other three.

So, let's assume that the bookie thinks that the probability of Collingwood defeating the Dogs if those two make the Grand Final is 80%. Given that, we can say that the bookie must also believe that:

  • The probability that Collingwood would beat St Kilda if that were the Grand Final matchup is about 61%.
  • The probability that Geelong would beat St Kilda if that were the Grand Final matchup, is about 66%.
  • The probability that Geelong would beat the Dogs if that were the Grand Final matchup is higher than 72%.

Together, that forms a plausible set of probabilities, I'd suggest, although the Geelong v St Kilda probability is higher than I'd have guessed. The only way to reduce that probability though is to also reduce the probability of the Pies beating the Dogs.

If you want to come up with your own rough numbers, choose your own probability for the Pies v Dogs matchup and then adjust the other three probabilities using the four equations above or using the following approximation:

For every 5% that you add to the Pies v Dogs probability:

  • subtract 1.5% from the Pies v Saints probability
  • add 2% to the Cats v Saints probability, and
  • subtract 5.5% from the Cats v Dogs probability

If you decide to reduce rather than increase the probability for the Pies v Dogs game then move the other three probabilities in the direction opposite to that prescribed in the above. Also, remember that you can't drop the Pies v Dogs probability below 55% nor raise it above 100% (no matter how much better than the Dogs you think the Pies are, the laws of probability must still be obeyed.)

Alternatively, you can just use the table below if you're happy to deal only in 5% increments of the Pies v Dogs probability. Each row corresponds to a set of the four probabilities that is consistent with the TAB Sportsbet markets as they currently stand.


I've highlighted the four rows in the table that I think are the ones most likely to match the actual beliefs of the TAB Sportsbet bookie. That narrows each of the four probabilities into a 5-15% range.


At the foot of the table I've then converted these probability ranges into equivalent fair-value price ranges. You should take about 5% off these prices if you want to obtain likely market prices.