
;)
Persistence in Team MARS Ratings
Over the course of the last two blogs we've investigated the season-to-season correlations in team winning percentages and in team scoring behaviour. In this blog we'll look, far more briefly, at the season-to-season correlations in team MARS Ratings.
MARS Ratings have been calculated only for the period 1999 to 2012 and were set to 1,000 for all teams at the very start of that period so, on the assumption that the first year was a calibrating year, I'll consider only the seasons from 2000 to 2012 in this blog.
MARS Ratings : This Season vs Earlier Seasons
Recall that a team's initial MARS Rating for a new season is set to 47% of the MARS Rating it finished with at the end of the previous season plus 530. Bearing that in mind we should expect there to be a relatively high correlation between a team's MARS Rating at the end of one home-and-away season and the end of the next - probably higher than the correlation between the team's winning record from one season to the next.
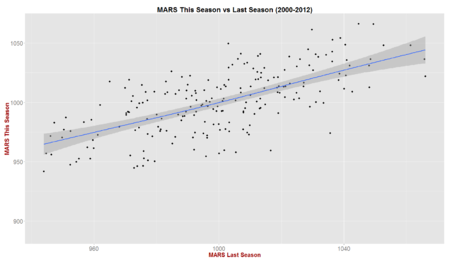 That is, indeed, the case, though the correlation in season-to-season MARS Ratings of +0.669 is only a little higher than the correlation of +0.50 in season-to-season winning percentages for teams during the period from 1990 to 2012, the final era used in earlier blogs.
It's interesting to note from the chart at right that only one team has finished a home-and-away season with a MARS Rating over 1,025 having finished the previous season with a MARS Rating under 1,000.
Conversely, no team that finished one home-and-away season with a MARS Rating exceeding 1,040 has finished the next with a MARS Rating under 1,000.
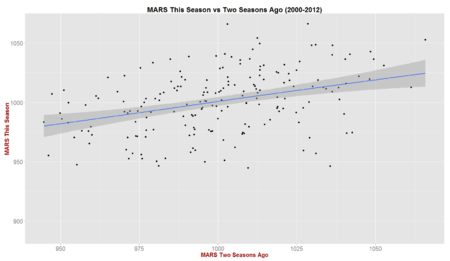 Looking next at the correlation between a team's end of home-and-away season MARS Rating this season compared with two season's prior we find a correlation of +0.392, which once again is a little higher than the equivalent correlation for winning percentages of +0.27.
Exemplifying the lower inter-temporal correlation we now find teams with Ratings below 1,000 earning Ratings as high as 1,040 just two seasons later and, conversely, teams with Ratings of 1,040 in one season slumping to Ratings as low as 975 two seasons later.
So, as we saw for teams' winning and scoring performances, team Ratings can change quite considerably in just two seasons.
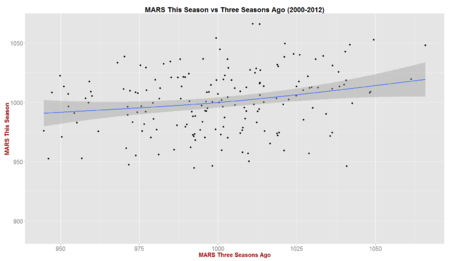 In three seasons they can change even more though, so much so that the correlation in team Ratings three years apart is just +0.235, again only a little higher than the correlation in winning percentages, which is +0.14.
With such a low level of correlation we now see even more dramatic changes in team Ratings, some of the starkest being Ratings declines from around 1,040 to below 950, and climbs from below 975 to around 1,040.
As well, we find teams Rated around 1,000 three seasons ago might now Rated as low as 950 and as high as 1,050.
Predicting a Team's Winning Percentage : Use Last Year's Winning Percentage or MARS Rating?
If all you were given was a team's winning percentage in the home-and-away part of the previous season and its MARS Rating at that same point, which would provide a better predictor of the team's winning percentage this season, and how good would that prediction be?
Assuming that we constrain ourselves to linear models - and that we conveniently ignore the 0-1 nature of the dependent variable and allow ourselves to use Ordinary Least Squares - the model with last year's MARS Rating wins out.
That model is: Predicted Winning Percentage = - 313.9% + 3.6425 x Last Year's MARS Rating / 1,000, which has an R-squared of 24.3%, some 1.3% points better than the linear model involving teams' winning percentage from the previous season. (For the record, that model is Predicted Winning Percentage = 26.3% + 0.482 x Last Year's Winning Percentage).
One likely reason MARS Rating is a better predictor of next season winning performance than is last season winning performance is that the MARS Rating is as at the end of the home-and-away season whereas historical winning performance is averaged across the entire season to that point. Comparing the predictive power of MARS Ratings to, say, teams' winning percentage in the second half of the season might yield a different outcome.
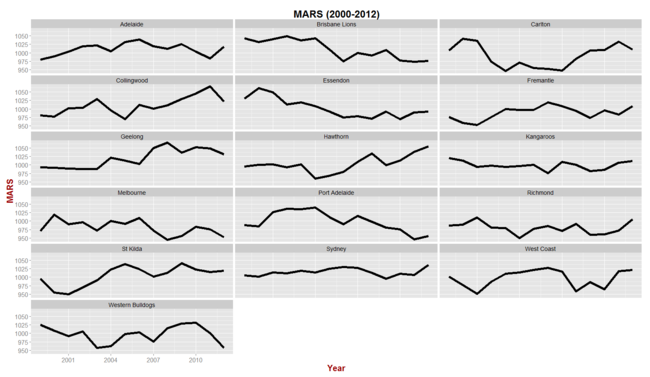
Anyway, to finish, here's a chart of the end of home-and-away season MARS Rating across the period 2000 to 2012 for all teams that have existed in each of the 13 seasons.
 TonyC
TonyC
Reader Comments