
;)
Gotta Have Momentum
Momentum, footy commentators will assert at least a few dozen times a season, is vital. When a team has it they string passes together, goals together, quarters together, wins together, maybe even flags together; when they don't, well they don't string much together at all except excuses.
So, I wondered, what might momentum look like, which teams seem to display it and which don't?
To answer these questions I've analysed the win-loss records of the 16 teams over the past 10 seasons and investigated each team's ability to record back-to-back to results. If a team is prone to bouts of momentum then we'd expect it to record back-to-back wins at a rate higher than we could reasonably expect based on its average winning rate.
But momentum can be a force for evil as well as for good and might instead manifest in a team's proclivity to heap loss upon loss, once again at a rate that's higher than we might predict based on its average losing rate.
As usual, a concrete example should help cement these ideas and give us a foundation to build upon. (Okay, enough already with the construction metaphors.)
Richmond, it turns out, has won roughly 38% of its games over the period 2000 to 2009 but it has won 51% of games after it has won in the previous round. That's a 13 percentage point difference. Momentum, thy name is Richmond.
The Tigers' losses are also flecked with momentum. Over the 10 seasons they've lost about 62% of matches but this rises to 70% when they've lost in the previous round.
Richmond, it seems, tend to either be stringing losses together or stringing wins together - and more often the former than the latter.
Actually, a moment's thought will lead you to conclude that a team exhibiting win-related momentum will also certainly exhibit some level of loss-related momentum too since any clumping of wins needs to be offset by a clumping of losses if the team's overall win rate is to be preserved.
But are the differences we see for Richmond so large that we can discount the possibility that they were caused solely by chance?
In a word: yes.
A similar conclusion can be reached from an analysis of the results for St Kilda, Melbourne, Geelong and Port Adelaide and, if we limit our discussion to momentum exhibited in the pattern of losses, for the Bulldogs and Essendon too. That means there's statistical evidence for momentum in at least some of the results for about half the teams in the competition.
Before I discuss what I mean by "statistical evidence", here's the data for all the teams:
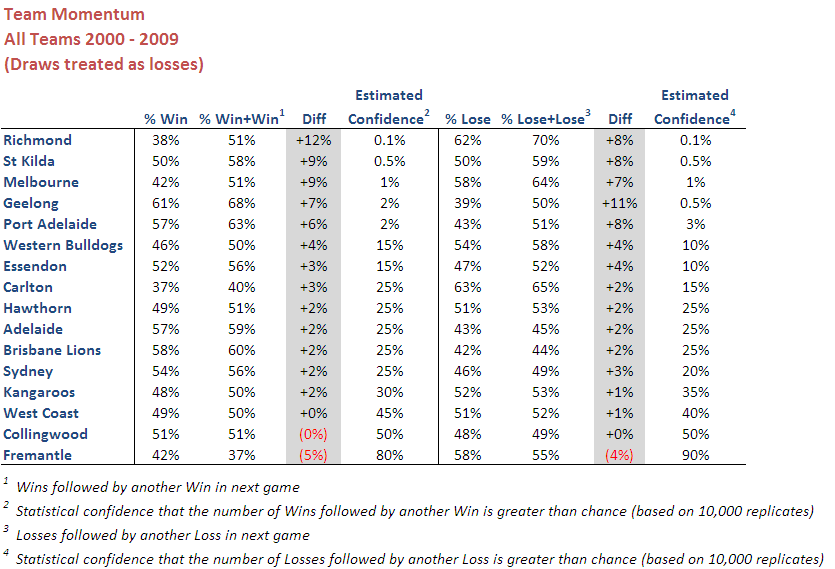
Consider the row for Richmond. The % Win column gives us Richmond's overall win percentage across the 10 seasons (treating draws as losses), the % Win+Win column gives us the percentage of occasions on which Richmond followed a win with another one. Diff gives us the percentage point difference in these two rates and; logically, a larger difference implies a higher likelihood of momentum being an explanation.
The Estimated Confidence column is the one that summarises the statistical evidence I referred to earlier. The numbers in this column give a statistical indication of how likely it is that a team would have recorded a figure as high as is shown in the % Win+Win column if it randomly won at the rate shown in the % Win column. In Richmond's case the Estimated Confidence is 0.1% meaning that there's only about 1 chance in 1,000 that the rate of back-to-back wins is due solely to chance.
(Technical note: calculating confidence intervals for the expected number of back-to-back wins is not as straightforward as it might appear. The expected proportion of wins after a win for a given team is, curiously, not equal to a team's overall winning rate and the distribution is skewed. As a consequence I needed to build the confidence intervals using Monte Carlo simulations. Sometimes you find complexity in statistics where you least expect it.)
The remaining columns provide the same information but for losses (combined with draws) instead of wins.
Statisticians will generally deem as "significant" a result with a confidence of 10% or lower (though there are some curmudgeons who set 5% as their limit), which explains my earlier claim about which teams appear to exhibit momentum.
As you can see, another half dozen teams - those with results producing confidence levels in the 15% to 30% range - have patterns in their wins and losses that hint at momentum without brazenly declaring it.
Only West Coast, Collingwood and Fremantle have results that appear to be devoid of traces of momentum.
So, what does all this mean?
Not much, perhaps, although you might want to remember this when you're agonising over a tip sometime during the season.
(Come to think of it, momentum might also be one reason that our streak-based tipping heuristics have performed so creditably in recent seasons.)
Oh and I guess it does provide an excuse, however feeble, for those momentum-mad commentators.
 TonyC
TonyC
Reader Comments