Search MAFLOnline
Subscribe to MAFL Online


Contact Me

I can be contacted via Tony.Corke@gmail.com


Latest Information


Latest Posts
Sunday
Sep122010

Simulating the Finals (After Week 2 of the Finals)

Another week, another 1,000,000 simulations.

This week it's a relatively brief summary, since there are only four teams remaining and because TAB Sportsbet no longer has markets for teams' chances of making the Grand Final nor for the possible Grand Final pairings.

Here's what I have by way of simulation inputs and outputs:


Firstly note that I have the Dogs, who have the higher MARS Rating, as favourites to defeat the Saints. That certainly isn't the way that the TAB Sportsbet bookie is seeing it: in the row labelled "Offer" you can see that he currently has the Saints at $3 for the Flag and the Dogs at $11. Not surprisingly, the simulations suggest the Dogs are very good value at that price - hence the double-asterisk under them.

The Cats too, however, are value in the Flag market, priced as they are at $3. The simulations suggest that anything over about $2.60 represents value for them.

Collingwood, at $2.75, are about $0.45 too short to be attractive, and the Saints, at $3, are way too short to be worthy of a punt.

All four possible Grand Final pairings are near equally likely, with a Cats v Dogs matchup marginally the most likely pairing for the Big One, and a Pies v Saints matchup the least likely.

Sunday
Sep052010

Simulating the Finals (After Week 1 of the Finals)

Okay, six teams left, and you know the drill.

Here's the probability matrix I'm using this week (and again we're ignoring any home ground benefits):

Running the now customary 1,000,000 simulations using this matrix gives us the probabilities shown in the tables below. The rows labelled "Fair" contain fair value prices and those labelled "Offer" contain the most-recent TAB Sportsbet prices.

Double-asterisks denote those wagers that the simulations suggest represent value. As has been the case for a while now, the simulations suggest that the Dogs represent value in both the Flag and the Plays-in-the-GF market.

As well, the Cats are a value bet at $4 for the Flag; the simulations suggest that any price over about $3.30 for them represents value.

In contrast, Sydney and Freo represent appalling value at only $13 and $41 respectively. You'd instead want about $30 and $125 respectively to feel as though you were obtaining fair value for this pair.

Lastly, a look at the GF Quinellas, where you'll notice that only 9 possible Grand Final pairings remain possible:

Here, the value combinations are indicated by green shading, and all of the value bets involve the Dogs.

Whether the Dogs are value bets or not all still comes down to the extent to which you believe that the Dogs' recent performances are the best indicators of their likely performance next week and, if they survive, in the weeks that follow.

Sunday
Aug292010

Simulating the Finals (After Round 22)

I've just run a quick 1 million simulations of the finals using the following probability matrix, which is based on each team's current MARS Rating and assumes that there is no home ground advantage in the finals:

With this matrix and a slab of CPU seconds, I obtain the following probabilities for each team (1) playing in, and (2) winning the Grand Final:

Probabilities shown shaded green are those corresponding to value TAB Sportsbet wagers. Still we find that the TAB bookie is - according to MARS Ratings and my simulations - undervaluing the Dogs. He has them priced at $11 and I estimate them to be about $6.50 chances. That's quite a difference.

I'm also now suggesting that the TAB have the Cats inappropriately rated, so a wager on them at $2.50 represents (slender) value. I rate them value at $2.45 and above.

Finally, a quick look at the GF Quinellas:

Only the Collingwood v Dogs matchup continues to offer value. It's currently priced at $6; I'd be happy to take anything over $5.60.

(I note in passing that the only impossible GF pairings from amongst the eight finalists are Fremantle v Hawthorn and Sydney v Carlton, since these are the Week 1 finals matchups and one team from each of those pairings will be bowing out next weekend.)

Wednesday
Aug252010

Who Left the Dogs Out?

Freo's selectorial shenanigans of last weekend appear to have spooked the TAB Sportsbet bookie, so much so that he's not yet posted any of the line markets.

I expect he'll address this oversight sometime in the next 24 hours, in which case I'll post the week's wagering and tipping details tomorrow night.

In the meantime, here's a follow up blog on simulating the finals.

You'll recall from a previous blog that there are eight likely team orderings for the finals. They are the following:

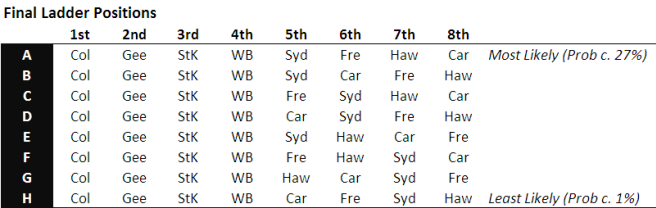
In the earlier blog, I reported how little it mattered for any team's flag chances which of these orderings eventuated - no team's probability varied by more than 0.5% in the simulated results across all eight orderings.

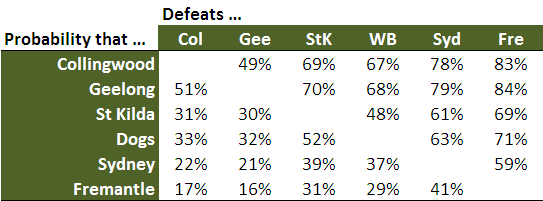
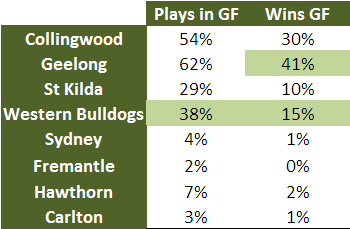
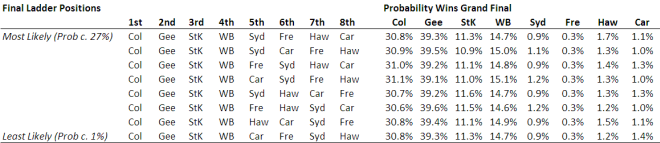
What I didn't report there was how much each team's chances of playing in the Grand Final varied across these eight orderings. So, let's have a look at that.

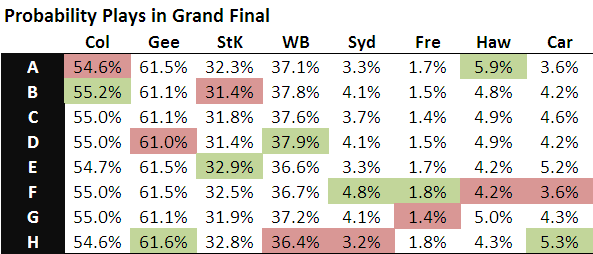
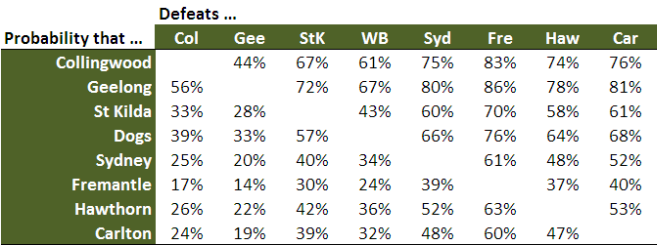
The cells highlighted in green flag the ordering that maximises a particular team's chances of playing in the Grand Final. So, for example, finishing order A - the current ladder order - maximises Hawthorn's chances of running around in the Granny. Cells highlighted in red represent orderings that minimse a team's chances of playing in the Grand Final. St Kilda, for example, would least like ordering B, because it would probably see them play Carlton in Week 2 of the Finals, who are rated 1,009 on MARS.

Though individual team's chances of playing in the Grand Final do not vary by a great deal across the eight most likely orderings, we do see larger differences than we saw for team's flag chances - of the order of 1-2% for teams likely to finish in positions 3 to 8.

For Sydney, Freo, Hawthorn and Carlton - all teams with small absolute chances of winning the flag - differences of this magnitude are quite material. For example, Carlton's chances of winning the flag increase by almost 50% (from 3.6% to 5.3%) as we move from ordering F to ordering H.

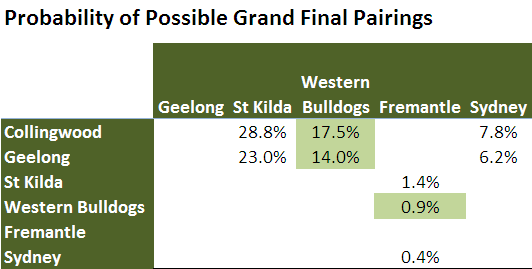
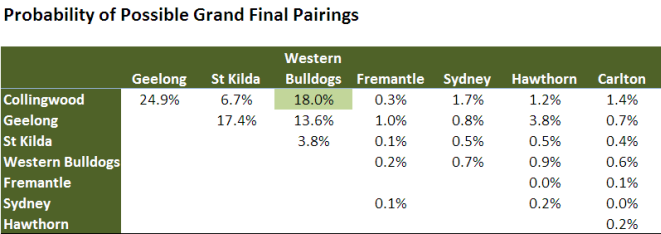
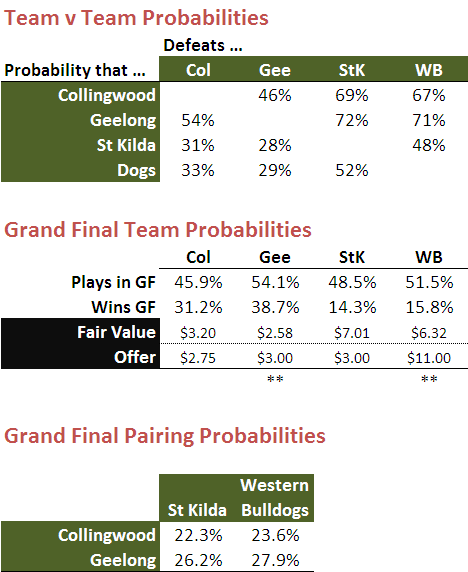
In the earlier blog we found that the Dogs represented the only value wager in the flag market. TAB Sportsbet also offer a market for the Grand Final pairing. The following table sheds light on the value in this market. It shows the probability for each of the 28 possible Grand Final pairings, for each of the eight most likely orderings.

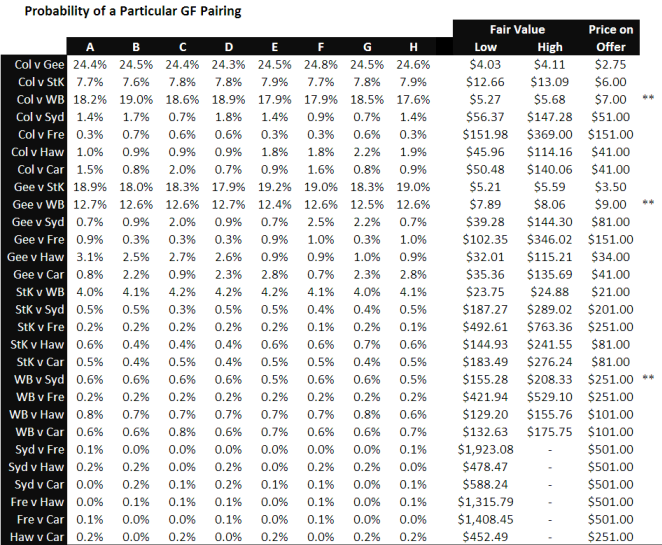
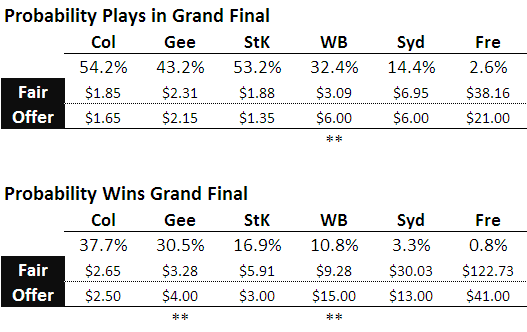
At the right of the table the range of fair value prices for each pairing is shown, based on the smallest and largest probability of that pairing occurring across the eight most likely final orderings.

Next to this range I've provided the latest prices on offer from TAB Sportsbet and flagged with a double-asterisk any pairing that represents value according to my simulated results.

As in the flag market, it's wagers involving the Dogs that seem to represent the greatest value in the GF pairings market: Grand Finals that have Geelong, Collingwood or Sydney facing the Dogs all look attractively priced based on current MARS Ratings.

Clearly, the TAB Sportsbet bookie rates the Dogs' chances very differently to MARS. He's significantly rerated the Dogs on the strength of their two most-recent outings. The Dogs have also seen their MARS Rating drop as a consequence of these two poor showings - by over 11.5 Ratings Points - but still lay claim to an impressive 1,031 MARS Rating.

It all comes down to how much weight you place on recent performance versus season-long pedigree.

Sunday
Aug222010

Final Ladder Positions and Team's Flag Prospects After Round 21

The teams that will comprise the final 8 are now determined - barring Lazarian performances - but their final order is not.

Here's what the latest simulations show about each team's likely ladder finish:

With no real interest in who'll make the eight, I wondered instead how much it matters if, say, Sydney finishes 7th rather than 5th?

To answer this question I needed a probability matrix showing, for example possible pairing of teams in the 8, the probability of victory for each team. To create this matrix I used the current MARS Ratings for each team and the following equation:

Probability of Victory = exp((0.712*(Own MARS Rating - Opponent's MARS Rating))/22.3) / (1+exp((0.712*(Own MARS Rating - Opponent's MARS Rating))/22.3))

This equation is based on equations I derived in earlier blogs and, importantly, assumes that there is no home ground advantage in the finals. It provides this probability matrix:

In the 100,000 simulations used to create the first chart there were only eight relatively likely finishing orders for the top 8 teams. For the next round of simulations I played out the 4 weeks of the finals 100,000 times for each of these eight finishing orders and recorded which team won the Grand Final in each simulation.

The results of this are summarised in the table below. As you move down the rows the relative likelihood of that particular set of ladder positions shrinks, from about 27% for the top row (which, as well as being the most likely finishing order is also the current order) to about 1% for the bottom row.

What's startling about this table is how little variability there is across the rows - these simulation results suggest that, this season, a team's finishing order will have very little impact on its absolute prospects of winning the flag.

Roughly speaking, Geelong are about a 39% chance of winning the flag, Collingwood are at about 31%, St Kilda's about 11%, the Dogs about 15%, and the rest are all around 0.5-1.5% each.

The lack of variability between the rows, I'd suggest, is largely because positions 1 to 4 are already determined - so there's no source of variability there - and because the teams in positions 5 to 8, based on their relative MARS Ratings, have little chance of toppling the teams above them. None of the teams in positions 5 to 8 has a probability greater than 38% of defeating a team from the top 4 even once, so doing it two or three times - which is what they'll need to do to win the flag - seems very unlikely.

If you believe these simulations, then the fair value prices are as follows (the current TAB Sportsbet prices are in brackets and any value bets are in bold):

  • Collingwood $3.25 ($3)
  • Geelong $2.55 ($2.50)
  • St Kilda $8.95 ($5)
  • Bulldogs $6.75 ($9)
  • Sydney $101 ($26)
  • Fremantle $336 ($51)
  • Hawthorn $74 ($15)
  • Carlton $87 ($51)

So, only the Dogs at $9 offer any value.

Page 1 ... 8 9 10 11 12 ... 13 Next 5 Entries »