
;)
Simulating the Finalists for 2013 : Post Round 22
What a strange and intriguing time it is to be following - and trying to predict - AFL football.
As I write this, just three days from the start of the last home-and-away round, and just one week more distant from the Finals, there's still no complete resolution of the Essendon debacle and no definitive statement about whether the Dons will or will not play in those Finals.
There are, however, credible reports that they have been omitted so, in presenting the results of this week's simulations, I've made it as easy as I can to interpret the ramifications with and without the inclusion of the Dons.
The first challenge the week is to come up with the inputs for the simulation routine. For this purpose I've persevered with the methodology I've been employing for the past five weeks, which yields the following expected margins for the season's remaining nine games.
;) The probabilities shown here are not significantly different from the probabilities implicit in the current TAB Bookmaker prices, with the exception of those for the Dons v Tigers game for which there is currently no TAB market.
The probabilities shown here are not significantly different from the probabilities implicit in the current TAB Bookmaker prices, with the exception of those for the Dons v Tigers game for which there is currently no TAB market.
Sydney's chances are rated a little more highly by me, and Port Adelaide's a little less so, but none of the differences exceeds about 8 percentage points.
Assuming the Dons are excluded from the Finals, five teams - Carlton, the Roos, the Lions, Adelaide and West Coast - are effectively vying for 8th place. The simulations suggest (see the column headed Top 9) that the Blues are about 3/1-on for that last place, the Roos 5/1 against, Adelaide are at 20s, the Lions at 30s, and the Eagles are pretty much in "write your own ticket" territory.
;) In other simulated results, Hawthorn are narrow favourites for the minor premiership and GWS are unbackable for the Spoon (but see below).
In other simulated results, Hawthorn are narrow favourites for the minor premiership and GWS are unbackable for the Spoon (but see below).
It is, by the way, mathematically possible for the Cats to win and the Hawks to lose and thus for both teams to finish level on competition points, yet for the Hawks to take out the minor premiership despite entering the round with an inferior percentage.
If the Hawks were to lose a low-scoring thriller, say 69-70, and the Cats were to win a high-scoring thriller, say 130-129, then the Hawks' percentage would become (2,411 + 69) / (1,759 + 70) = 135.6, while the Cats' would finish (2,297 + 130) / (1,665 + 129) = 135.3. Essentially, the reason for this apparently curious outcome is that the weighting of any game in a team's overall percentage is roughly determined by the points it concedes in that game (see this blog for more details), so the Hawks' low-scoring game would hurt its percentage less than the high-scoring but close game would hurt the Cats'.
At the other end of the ladder, the simulations probably understate the Dees' Spoon prospects because they're based on the simplifying assumption that a team's percentage - its points for divided by its points against - is well-proxied by its points differential - its points for less its points against. Generally that's a reasonable assumption, but in the case of extremes such as the Dees and the Giants, it breaks down a little. Currently, we have:
- Dees : Points Differential = -1,216; Percentage = 52.9
- GWS : Points Differential = -1,383; Percentage = 51.4
As far as the simulations are concerned, to surrender the Spoon GWS needs to overcome the 167 point difference between its and the Dees' differential, a very unlikely outcome. In reality GWS need only to defeat the Suns, which is somewhat unlikely, and have the Dees go down to the Dogs by, say, 10 goals. I'd put the joint probability of those events at about 2-5%, not the 0.04% estimated in the simulations.
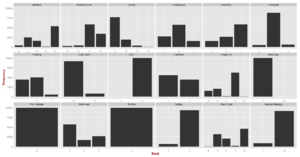
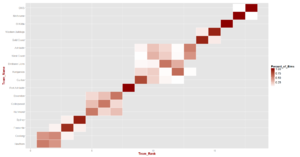
Recognising that slight limitation of the methodology, here's the usual team probability density chart and heatmap.
Returning our focus to the top of the ladder, here, firstly, are the simulated outcomes for 1st and 2nd spots.
;) The most common result is for a Hawks-Geelong 1-2 finish, and the second-most common is for the reverse. Combined these pairings account for all but 5% of the simulations.
The most common result is for a Hawks-Geelong 1-2 finish, and the second-most common is for the reverse. Combined these pairings account for all but 5% of the simulations.
Fremantle's slipping into 2nd would require the Cats to lose and Fremantle to win or draw, or for the Cats to draw and Fremantle to win, which are both unlikely scenarios since they depend on the Cats coming unstuck against the Lions.
Next let's broaden our view to take in the Top 4.
;) Almost one-half of the simulations finished with a Hawks-Cats-Freo-Swans Top 4, and most of the remaining simulations had the same four teams with the Hawks and the Cats exchanging 1st and 2nd.
Almost one-half of the simulations finished with a Hawks-Cats-Freo-Swans Top 4, and most of the remaining simulations had the same four teams with the Hawks and the Cats exchanging 1st and 2nd.
No other Top 4 appeared in more than about 1 in 16 simulations, and the least likely, a Hawks-Cats-Swans-Freo finish, appeared in only 1 in 200.
The Dons' complication intrudes as we consider ladder positions 5th to 9th.
;) In presenting these simulation results I've grouped firstly on the basis of the simulations that, Essendon excluded, have the Tigers finishing 5th (the top half) or have the Pies finishing 5th (the bottom half).
In presenting these simulation results I've grouped firstly on the basis of the simulations that, Essendon excluded, have the Tigers finishing 5th (the top half) or have the Pies finishing 5th (the bottom half).
Within these broad groupings I've subdivided them on the basis that, within a subdivision, the ordering is the same ignoring the Dons. So, for example, in the top 2 orderings in the table we wind up with Richmond-Collingwood-Port-Carlton in either case once we ignore the Dons. That ordering is the most likely according to the simulations and occurred over 50% of the time.
The next most-likely ordering is the first of the lower half of the table and is Collingwood-Richmond-Port-Carlton, the outcome that resulted from about 25% of simulations.
Lastly, consider the composition of the Finalists as a whole.
;) Here I've shown only the most common simulated orderings (and, again, I've grouped on the basis of equivalence if Essendon are excluded), the most commonest of which was:
Here I've shown only the most common simulated orderings (and, again, I've grouped on the basis of equivalence if Essendon are excluded), the most commonest of which was:
- Hawthorn
- Geelong
- Fremantle
- Sydney
- Richmond
- Collingwood
- Port Adelaide
- Carlton
This was the final ordering in just over 25% of simulations. The next-most common ordering swapped Hawthorn and Geelong, and occurred in about 20% of simulations.
 TonyC
TonyC
Reader Comments