
;)
The Seasons We Might Have Had So Far in 2013
The notion that the outcome of a sporting event is a random variable is a theme I've explored on MAFL many times before. It feels quite natural to apply the notion to prospective contests, but a little odd to apply it retrospectively.
Nonetheless, that's what I'm going to do for this blog.
Specifically, what I'm going to do is to replay by way of simulation the first 17 rounds of the 2013 season under three different scenarios:
- Where the outcome of every game is treated as being distributed as a random Normal variable with mean equal to the negative of the TAB Bookmaker's handicap on line betting and with a standard deviation of 36 points.
- As for Scenario 1 but assuming instead that the standard deviation for each game is 30 points.
- Where the outcome of every game is treated as being distributed as a random Normal variable with mean equal to the actual final margin of the game and with a standard deviation of 36 points.
We can think of simulations under Scenario 1 as being simulations of how the season would have panned out if we assume that the TAB Bookmaker's assessments have provided an unbiased assessment of teams' chances in every game and if the "natural" variability of each game was a constant, summarised by the standard deviation of 36 points per game, which is roughly what we've assessed it to be historically in various previous blogs.
Simulations under Scenario 2 can be thought of similarly, except that we assume the "natural" level of variability has been reduced this season, for reasons unspecified, to be just 30 points per game.
Under Scenario 3 we ignore anything that the TAB Bookmaker might have thought and instead assume that the best pre-game assessment of any game's predicted margin is (would have been?) the margin that eventually prevailed in that game.
SCENARIOS 1 AND 2: BOOKMAKER-HANDICAP BASED SIMULATIONS
I'd originally planned to present the results for these two scenarios separately, but they turned out to be so similar that it made more sense to array them side-by-side, the more to make this similarity apparent.
In each case, the results are for 10,000 replicates of the relevant scenario.
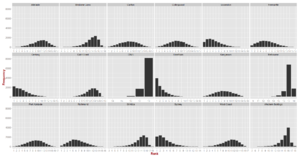
Firstly, here are the density maps (with a standard deviation of 36 on the left, and of 30 on the right):
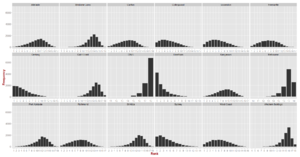
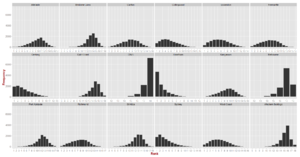
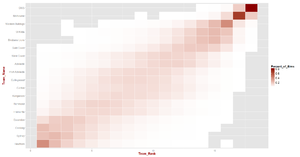
The heatmaps for these scenarios paint a similarly similar picture (where the redder the cell the greater the number of simulations in which the relevant team [the row] finished in a particular ladder position [the column]) :
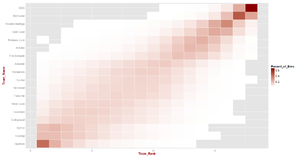
In summary then, the distributions of simulated ladder positions for every team don't much depend on our choice of standard deviation.
That's mildly interesting, but what's perhaps more interesting is to consider how the simulated ladder positions differ for each team relative to their actual current ladder positions.
;) These tables are sorted by the teams' current competition ladder position, and you can compare this ranking with each team's average ranking by looking at the final two columns in each table.
These tables are sorted by the teams' current competition ladder position, and you can compare this ranking with each team's average ranking by looking at the final two columns in each table.
So, for example, consider Essendon, who currently lie 2nd on the competition ladder. Their average ranking in the simulations was about 6th, and this is the 5th-highest average ranking of all the teams.
In that sense then, they're currently three places higher than the TAB Bookmaker would have expected.
The differences between any team's current ladder positions and its average simulated ranking can be attributed to TAB Bookmaker errors in assessing the team's chances in the games it's played, to the impact of random variability, or to a combination of both.
Teams for which these differences are greatest are:
LUCKY AND/OR BETTER THAN THE BOOKIE THOUGHT
- Essendon (2nd on the ladder, 5th on the simulations)
- Port Adelaide (8th on the ladder, 12th on the simulations)
UNLUCKY AND/OR WORSE THAN THE BOOKIE THOUGHT
- Collingwood (7th on the ladder, 4th on the simulations)
- West Coast (10th on the ladder, 6th on the simulations)
- Kangaroos (13th on the ladder, 10th on the simulations)
- St Kilda (16th on the ladder, 13th on the simulations)
What always amazes me about simulations like these is the small, but non-trivial likelihood that the season could have panned out so very differently for some teams, without making any alternative assumptions about their true abilities and hence likelihood of winning or losing any particular game.
Hawthorn, for example, in about 1.5% of simulations lie outside the Top 8, as do Geelong and Sydney in about 6% of simulations, and Essendon in almost 20%. In 1.5% of simulations Richmond sit atop the ladder, while in 1.4% Carlton reside there instead.
Port Adelaide probably best exemplify the extraordinary power of accumulated chance: in about 1 simulation in a 3,000 they sit in 1st (though it rounds to 0.0% in the table), but in more than 1 in 500 simulations they're in last. As fans I don't think we recognise just how big a role chance might well play in our team's fortunes.
SCENARIO 3 : USING ACTUAL RESULTS AS THE PREDICTED MARGINS
Let's now instead claim the considerable benefits of hindsight and assume that the best pre-game estimate of a game's final margin is what that margin turned out to be.
One way of thinking about what we're doing when we assume this is that we're making a post hoc assessment about how likely it was that the game's result could be been different, anchored by what it was. So, for example, we're assessing that a 2-point win could, instead, have been a loss about 48% of the time (using the Normal distribution with a mean of 2 and a standard deviation of 36), while a 20-point win would have been reversed less than 30% of the time had the random variability conspired differently.
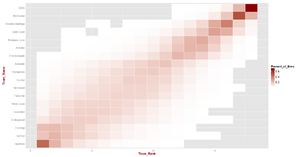
The density chart and heat map for these simulations follow (note that the heat maps are sorted by teams' average ranking in the simulations and so differ here from the ordering used in the earlier maps). The differences between the results depicted here and those shown for Scenarios 1 and 2 earlier reflect the extent to which a team's actual results have differed from the TAB Bookmaker's pre-game assessments.
These differences are most noticeable for:
- Collingwood, who are ranked 9th by this latest round of simulations but who were 4th in the Bookie-Handicap based simulations,
- West Coast, who are 12th here but who were 6th on the earlier simulations, and
- The Kangaroos, who are 7th here but who were 10th earlier
You can see these differerences far more clearly when I summarise the results of these latest simulations in a table along with the rankings that came from the earlier bookmaker-handicap derived simulations. For this purpose consider the two rightmost columns.
;) Comparing these latest simulations instead with the current competition ladder we find, much as you'd expect, since these latest simulations are based on what actually transpired in each game of the season, that the summary rankings shown here (in the column labelled "Rank from These Sims") are similar to the teams' actual current ladder positions.
Comparing these latest simulations instead with the current competition ladder we find, much as you'd expect, since these latest simulations are based on what actually transpired in each game of the season, that the summary rankings shown here (in the column labelled "Rank from These Sims") are similar to the teams' actual current ladder positions.
The only teams that move by more than one spot when we add a random component to the outcome of every game are Essendon, who fall two places to 4th; Sydney, who climb two places to 2nd; Collingwood, who fall two places to 9th; Port Adelaide, who fall two places to 10th; West Coast, who fall two places to 12th; the Brisbane Lions, who fall two places to 14th; and the Kangaroos, who climb a startling six places into 7th.
The Roos climb so many places because of the large number of narrow losses they've had this season. When these games are simulated they often switch from losses to wins for the Roos, far more often than games switch from wins to losses for the other teams near the Roos on the competition ladder. In fact, in almost 15% of the simulations, the Roos are currently in the Top 4, and in over 1% they lead the competition.
I'd contend that the difference between a team's actual current ladder position and its position in these latest simulations is a reasonable estimate of the effect that on-the-day luck has had on that team's fortunes. By any measure I think it's fair to say that the Roos have been especially unlucky this season.
 TonyC
TonyC
Reader Comments